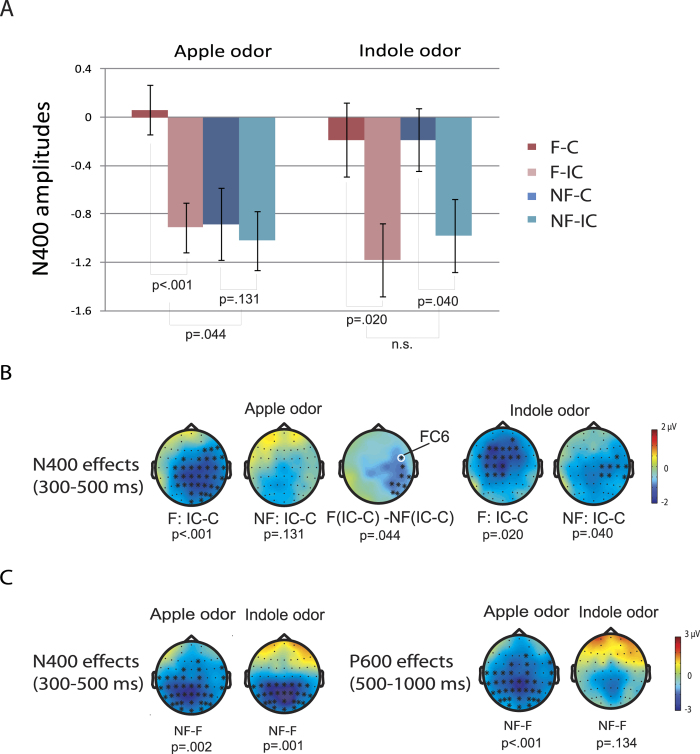
Figure 4. Averaged N400 amplitudes (300–500 ms) in different conditions.
Error bars stand for standard error of the mean, adjusted for individual differences. (B) Topographic distributions of the Congruence effect in different conditions. The topographies were plotted in the time interval of 300–500 ms. (C) Topographic distributions of the Context effect in different conditions. The topographies were plotted in the time intervals of 300–500 ms and 500–1000 ms. The electrodes that showed significant effects are marked as *. F: focus; NF: non-focus; C: congruent; IC: incongruent.

