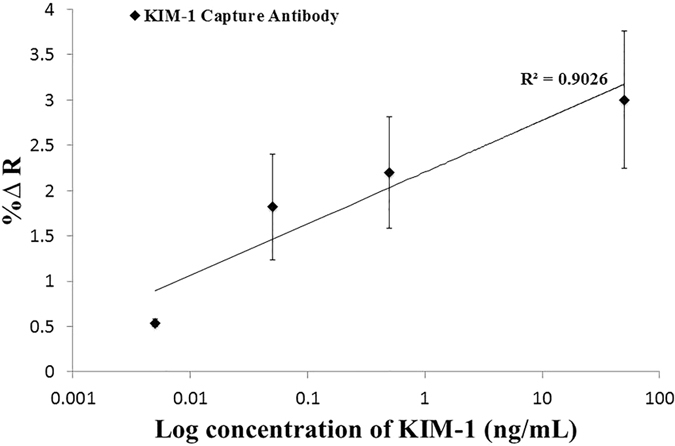
Figure 4. A concentration profile of Nanoenhanced SPRi signal in response to KIM-1 in buffer.

SPRi response (%∆ Reflectivity) represents the NanoEnhanced response upon the binding of NanoEnhancers to the various concentrations of KIM-1 biomarker (ng/mL) in phosphate buffer. The % change in reflectivity reported takes into account the IgG negative control signal, which is subtracted from the overall signal.
