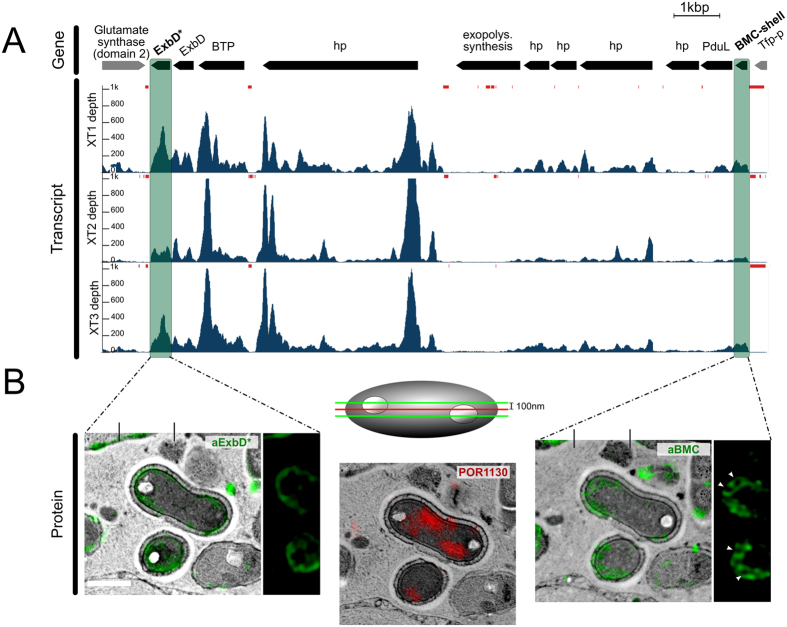
Figure 3. Integrative omics and microscopy study of the BMC-A genomic region.
(A) The genomic region and transcriptional profile of poribacterial SAG 3G. Gene abbreviations are: BTP = biopolymer transport protein, hp = hypothetical protein, Tfp-p = Tfp-pilus protein. Arrows indicate gene intervals and orientation. BMC group A genes are shown in black, others in grey. The transcript coverage (reads per genomic base) for three X. testudinaria metatranscriptiomes (XT1, XT2, and XT3) was illustrated using the Integrated Genome Viewer (IGB) tool. Loci with no read coverage are highlighted by red bars. (B) Proteins encoded in the BMC-A, BMC-shell marker (right; green; FITC) and ExbD proteins (left; green; FITC), were localised within poribacterial cells by FISH-IHC-CLEM. Ring shaped BMC-shell signals are indicated by arrowheads. Poribacteria cells were identified at ultrastructural resolution in Aplysina aerophoba tissue by FISH-CLEM using the Poribacteria-specific 16S rRNA probe POR1130 (middle image, red; Alexa546 double 5′3′ labelled). Micrographs represent the same cells on 3 consecutive sections of 100 nm distance as illustrated in the scheme. Separate channels are shown in Figure S1. Scale bars, 500 nm.

