
Fig. 1. Characterization of cytokine mRNA expression profiles after coactivation of TLR3 and TLR7.
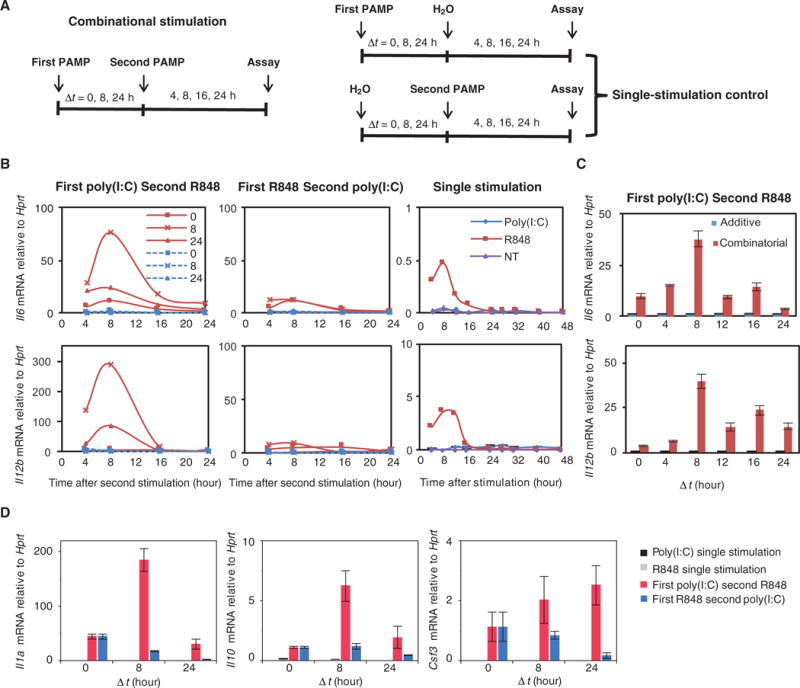
(A) Experimental design. BMDMs were treated with the first PAMP for 0, 8, or 24 hours and then were treated with the second PAMP for 4, 8, 16, or 24 hours. The controls for combined stimulation were stimulation with a single PAMP. (B) BMDMs were not treated (NT) or were treated with poly(I:C) (10 μg/ml) followed by R848 (25 ng/ml) (left), with R848 followed by poly(I:C) (middle), or with single PAMPs for the indicated times. The relative abundances of Il6 and Il12b mRNAs were then determined by qRT-PCR analysis. Data are representative of three independent experiments. Time intervals between the poly(I:C) and R848 treatments were 0 (■), 8 (×), and 24 (Δ) hours. Solid red curves show combinatorial stimulations, whereas dashed blue curves indicate additive controls as described in (A). (C) BMDMs treated with poly(I:C) for 0, 4, 8, 12, 16, or 24 hours and then with R848 for 8 hours were analyzed by qRT-PCR to determine the abundances of Il6 and Il12b mRNAs normalized to that of Hprt. (D) BMDMs treated with the indicated first PAMP for 0, 8, or 24 hours and then with the indicated second PAMP for 8 hours were analyzed by qRT-PCR to determine the relative abundances of Il1a, Il10, and Csf3 mRNAs. Data in (C) and (D) are means ± SEM of three independent experiments.