
Fig. 3. Model predictions and experimental validation.
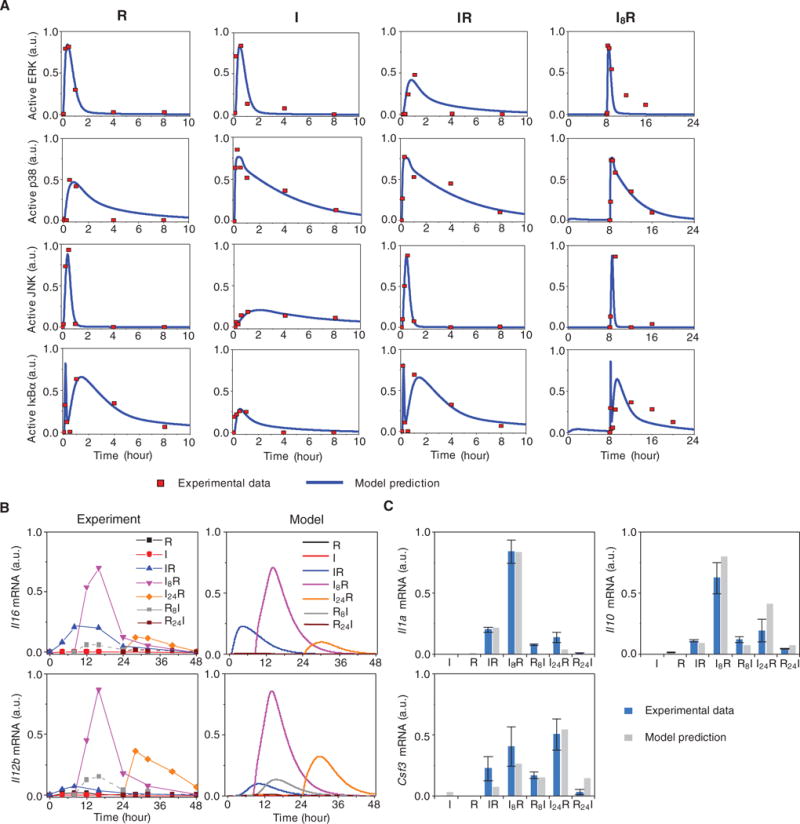
(A) Experimental and simulated protein dynamics of the TLR3 and TLR7 pathways. The time profiles of activated ERK, p38, JNK, and IκBα under the following four conditions were simulated with estimated parameters and were compared against the experimental data: R848 single stimulation (R), poly(I:C) single stimulation (I), poly(I:C) and R848 combinatorial stimulation with a 0-hour time interval (IR), and poly(I:C) and R848 combinatorial stimulation with an 8-hour time interval between the addition of each stimulus (I8R). The results of the model simulation are depicted in blue, whereas the results of the experimental analysis (13) are shown as red dots. a.u., arbitrary units. (B) Model predictions and experimental validation of the expression of Il6 and Il12b. The simulated time profiles of the relative abundances of Il6 and Il12b mRNAs under the indicated conditions (right; Model) were compared to the observed time-dependent synergistic effect induced by the combined activation of TLR3 and TLR7 (left). The experimental data points are connected by lines as a visual aid. The experimental data are representative of three independent experiments. (C) Model predictions and experimental validation of the relative abundances of Il1a, Il10, and Csf3 mRNAs under the indicated conditions. Data are means ± SEM of three independent experiments.