
Fig. 5. Dependency of the cytokine mRNA response on the time interval (Δt) between the two TLR stimuli.
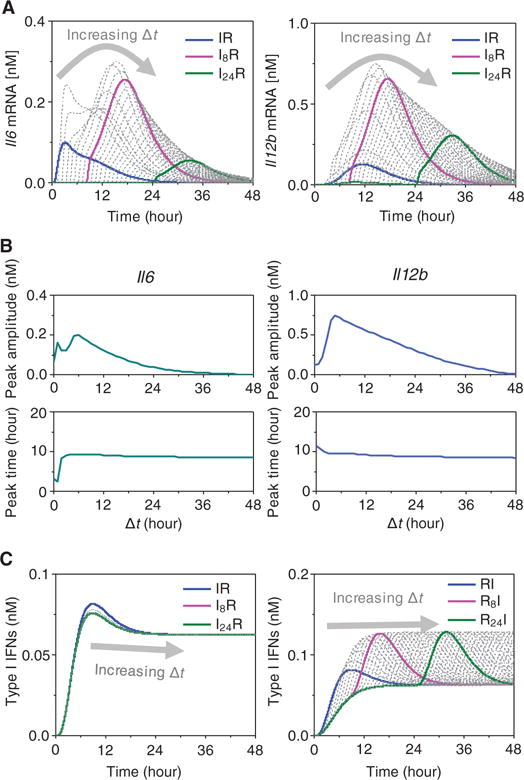
(A) Predicted time course of Il6 and Il12b expression (as determined by measurement of their mRNA abundances) in response to various combinatorial stimulations in which the time interval Δt between the first (I) and second (R) stimulus varied from 0 to 48 hours. The series of dotted curves represent results for successive Δt values, with the horizontal ordinate referring to the time elapsed with respect to the application of the first stimulus. Highest cytokine mRNA abundance occurs when the time interval between the two stimuli is ≈6 hours. The results for Δt = 0 (blue), 8 (magenta), and 24 hours (dark green) are depicted by the thick colored curves. (B) Peak amplitudes (top) and peak times (bottom) of Il6 (left) and Il12b (right) mRNA abundances derived from the curves shown in (A). (C) Predicted amounts of type I IFN produced in response to the indicated combinatorial IR (left) or RI (right) conditions with Δt ranging from 0 to 48 hours.