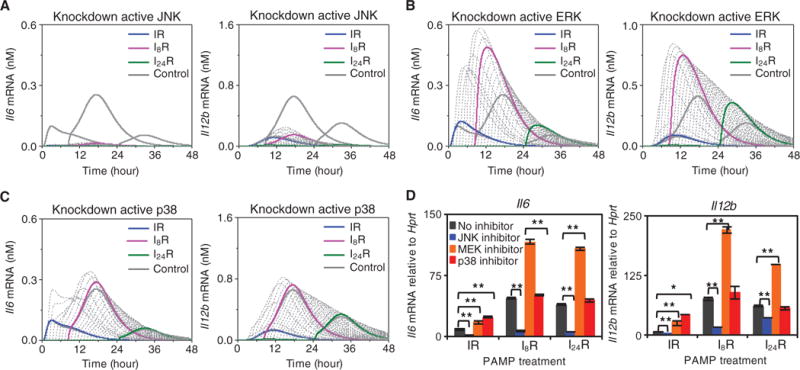
Fig. 6. Effects of inhibition of JNK, ERK, or p38 on cytokine production.

(A to C) Time-course analysis of changes in the abundance of Il12b mRNA (left) and Il6 mRNA (right) in the absence of JNK (A), ERK (B), or p38 (C) activity. The series of computational predicted curves refer to different time intervals between the two stimuli (similar to Fig. 5A). The curves for Δt = 0, 8, and 24 hours (colored, thick) were compared with those deduced from control simulations (thick, gray curves). (D) Experimental verification of computational predictions. BMDMs were treated with the indicated MAPK inhibitors (each at 10 μM) for 50 min and then were subjected to simulation according to the IR, I8R, or I24R conditions. After 8 hours of treatment with R848, the abundances of Il6 and Il12b mRNAs were measured by qRT-PCR analysis and were normalized to that of Hprt mRNA. Data are means ± SEM of three individual experiments.
