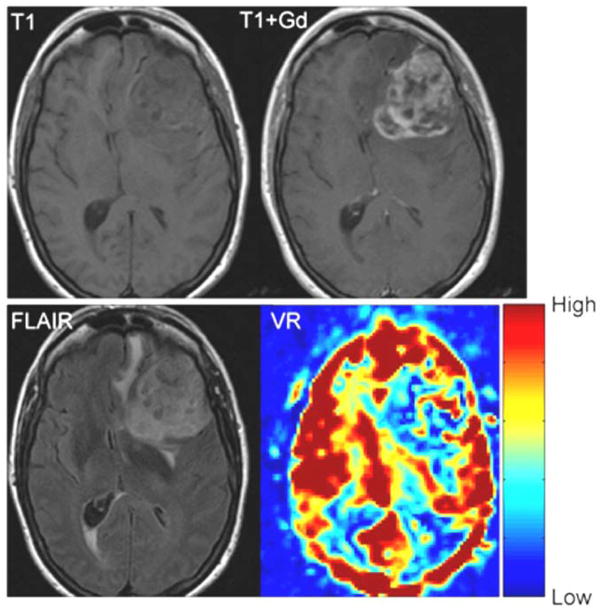
Fig 5.
T1 weighted, T1-weighted post contrast, FLAIR and VR map in a patient with a glioblastoma multiforme (Patient 11). The red areas show high VR and the blue areas show low VR. In normal appearing brain the gray matter shows high VR with a lower VR in the white matter. The volume of enhancement, FLAIR abnormality and VR abnormality are similar in this case

