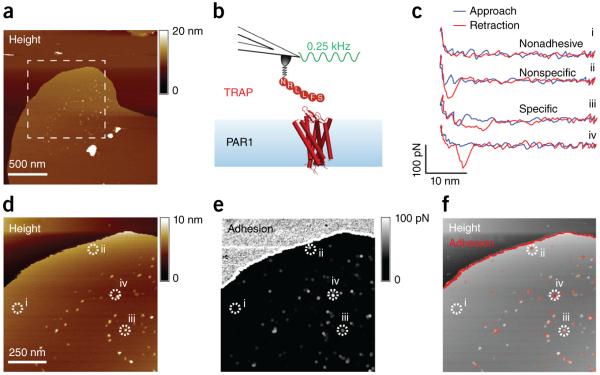
Figure 2.
Mapping ligand binding to human PAR1 using FD-based AFM. (a) Overview topography (height image) of human PAR1 reconstituted in liposomes made of 0.5 mg ml−1 phospholipids (DOPC) and 0.05 mg ml−1 of the cholesterol analog cholesteryl hemisuccinate (CHS) (Online Methods). (b) The topograph in a was taken with the SFLLRN ligand–functionalized AFM tip oscillated at 0.25 kHz and amplitudes of 50 nm. The membrane patches protruded 4.5 ± 0.7 nm (average ± s.d., n = 10) from the mica substrate (see supplementary Fig. 4). TRAP, thrombin receptor–activating peptide. (c) Representative force-distance curves recorded between the tip and the PAR1 proteoliposome. (d,e) Topograph (d) and adhesion map (e) of the boxed area in a. For visibility, adhesion pixels were enlarged 4× (e). (f) Overlay of adhesive interactions (red) with a representative AFM topograph (gray). Dashed circles and numbers localize force curves recorded in c. Similar results were obtained in 10 independent experiments. Other examples of topographs and adhesion maps are shown in supplementary Figure 7.

