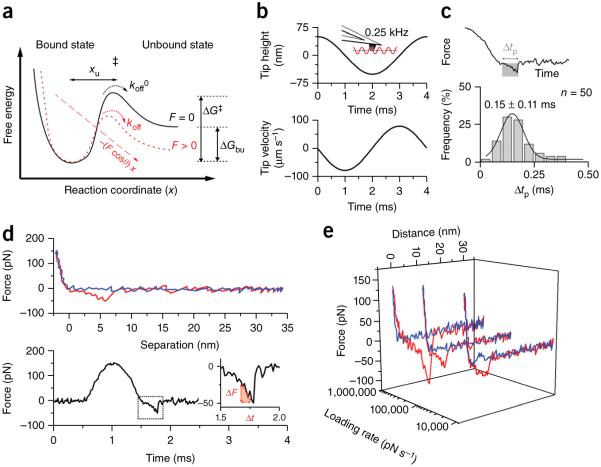
Figure 3.
Extracting energetic, thermodynamic and kinetic parameters from force curves describes the ligand-binding free-energy landscape. (a) According to the Bell-Evans model21, a ligand-receptor bond can be described using a simple two-state model. The bound state resides in an energy valley and is separated by an energy barrier from the unbound state. The transition state (‡) must be overcome to separate ligand and receptor. xu represents the distance between bound state and transition state, koff0 and koff are transition rates for crossing the energy barrier under zero force and applied force F, respectively. ΔG‡ gives the activation free energy to cross the transition state and ΔGbu the free-energy difference between bound and unbound state. (b) Oscillation of the tip with an amplitude of 50 nm and a frequency of 0.25 Hz induces a variation in the tip height (top) with a nonconstant tip velocity (bottom). (c) Because the time period (Δtp) stressing the bond until it ruptures is very brief (0.15 ± 0.11 ms; mean ± s.d.), the speed of the tip during Δtp, and thus the loading rate, can be considered constant. n gives the number of rupture events analyzed; values are binned by 0.05 ms. (d) A force-distance curve can be displayed as a force-time curve, from which the loading rate can be extracted via the slope of the curve just before bond rupture (LR = ΔF/Δt). (e) Representative force-distance curves (from n > 1,000 force curves) recorded at different loading rates.

