
Figure 2. The Effects of Dietary Macronutrients and Energy Intake on Longevity.
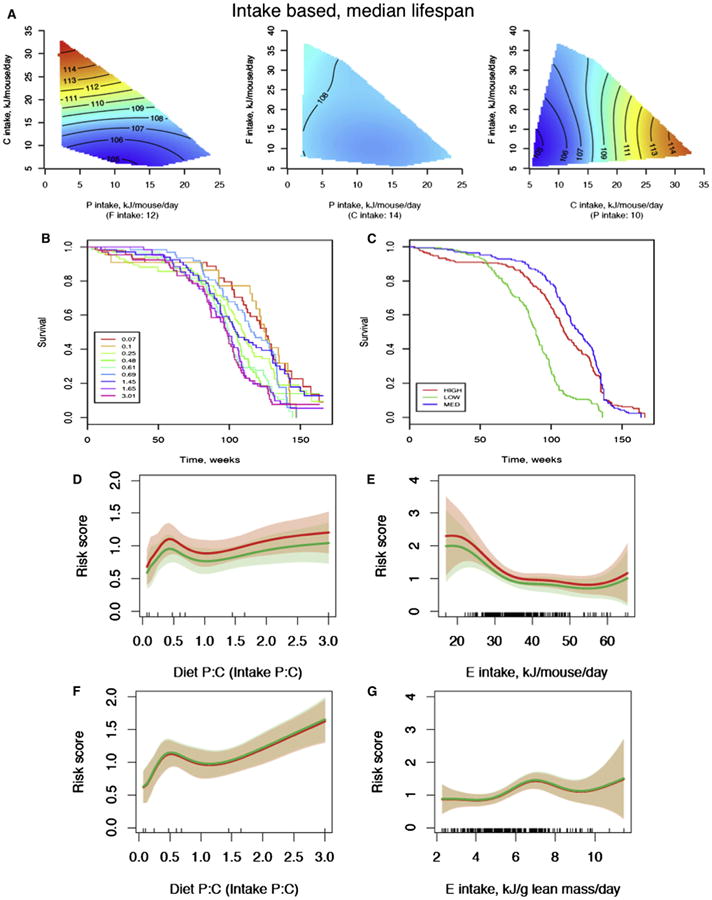
(A) Response surfaces showing the relationship between protein (P), carbohydrate (C), and fat (F) intake versus median lifespan (weeks). For each 2D slice, the third factor is at its median (shown below the × axis in parentheses). In all surfaces, red indicates the highest value, while blue indicates the lowest value, with the colors standardized across the three slices.
(B and C) Kaplan-Meier survival curves according to differing dietary protein:carbohydrate ratios (B) and dietary energy density (C).
(D) The relationship between the ratio of protein to carbohydrate in the diet and the risk of death. A Cox regression analysis was performed with gender and energy intake as covariates for males (red) and females (green). The bands show the 95% confidence intervals.
(E) The relationship between energy intake and the risk of death. A Cox regression analysis was performed with gender and the ratio of dietary protein to carbohydrate as covariates.
(F) As for (D), but based on protein:carbohydrate intakes corrected for lean body mass.
(G) As for (E), with energy intake corrected for lean body mass. See also Table S4.