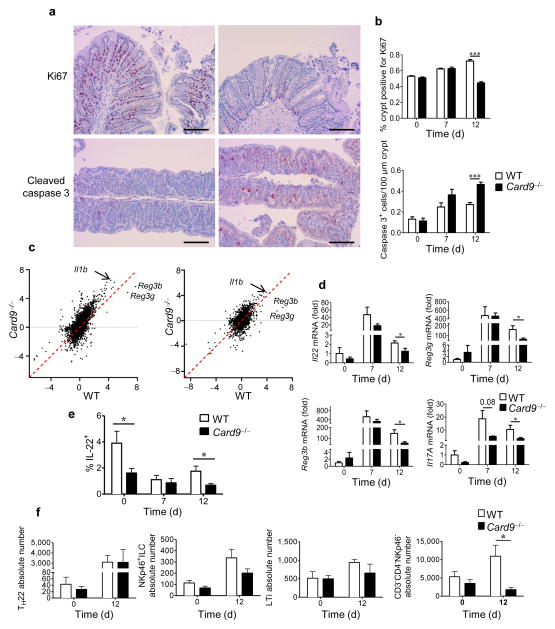
Figure 1.
CARD9 is involved in recovery from colitis. (a) Representative immunohistochemistry images for cross-sections of the proximal colon from WT (left) and Card9−/− (right) mice stained for Ki67 (top) or cleaved caspase-3 (bottom) at day 12. Scale bars, 200 μm. (b) Quantification of Ki67 (top) and cleaved caspase-3 (bottom) staining in the proximal colon of WT and Card9−/− mice before and at days 7 and 12 after induction of colitis. Data are mean ± s.e.m. (c) Comparative expression of genes in the colon by microarray data analysis (log2-transformed (fold change, as compared to that at day 0)) on day 7 (left) and day 12 (right) after initiation of DSS treatment. (d) Il22, Reg3g, Reg3b, and Il17A transcript expression in the colon before (day 0, n = 3 mice per group) and after (day 7, n = 5 mice per group; day 12, n = 10 mice per group) initiation of DSS treatment. (e) Proportion of IL-22+ cells in the lamina propria of the colon in WT and Card9−/− mice. (f) Quantification of subpopulations of IL-22+ cells isolated from the lamina propria of the colon of WT and Card9−/− mice before (day 0) and after (day 12) DSS treatment. Cells were gated on CD3+CD4+ (for TH22), CD3−CD4−NKp46+ (for NKp46+ ILCs), CD3−CD4+NKp46− (for LTi), and CD3−CD4−NKp46−. In a–c, n = 3 (day 0) and n = 5 (days 7 and 12) mice per group; in e,f, n = 5 mice per group. Throughout, data are mean ± s.e.m. *P < 0.05; ***P < 0.001; by two-tailed Student’s t-test.

