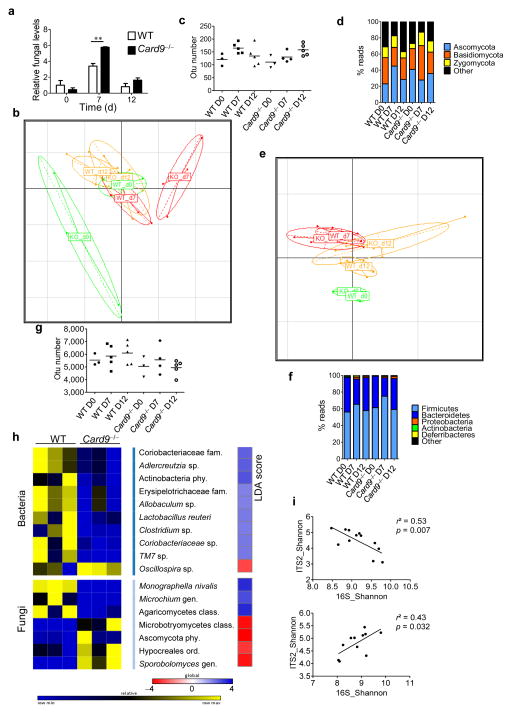
Figure 2.
The fungal and bacterial microbiota are altered in Card9−/− mice. (a) Fungal levels in the fecal microbiota were quantified using 18S rRNA qRT–PCR and were normalized to those of the bacterial population. Data are mean ± s.e.m. **P < 0.01 by two-tailed Student’s t-test. (b) Principal component analysis (PCA) based on fungal ITS2 rDNA gene sequence abundance in the feces. Axes correspond to principal components 1 (x axis) and 2 (y axis). d, day; KO, Card9−/− mice. (c) Fungal diversity on the basis of the operational taxonomic unit (OTU) number in the fecal samples from WT and Card9−/− mice. Horizontal line depicts the mean. (d) Fungal-taxon-based analysis at the phylum level in the fecal microbiota. (e) PCA plot based on bacterial 16S rDNA gene sequence abundance in fecal content. Axes correspond to principal components 1 (x axis) and 2 (y axis). (f) Bacterial-taxon-based analysis at the phylum level in the feces. (g) Bacterial diversity based on the OTU number in the fecal samples. Horizontal line depicts the mean. (h) Bacterial and fungal taxa differentially enriched in WT and Card9−/− mice (generated using LeFSE analysis). The heat map on the left shows the relative abundance of taxa, and the heat map on the right shows the linear differential analysis (LDA) scores. (i) Correlation between ITS2 and 16S rDNA Shannon diversity index in the fecal samples from DSS-treated WT (top) and Card9−/− (bottom) mice. Significance determined using linear regression. **P < 0.01, two-tailed Student’s t-test (a) and one-way analysis of variance (ANOVA) and post hoc Tukey test (c,g). Throughout, n = 3 mice per group for day 0, and n = 5 mice per group for days 7 and 12.

