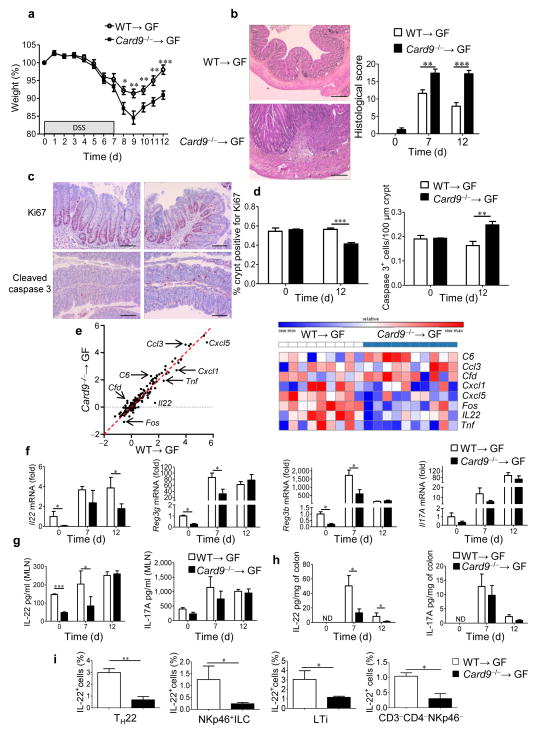
Figure 3.
Transfer of the microbiota from Card9−/− mice is sufficient to increase susceptibility to colitis and reduce IL-22 production. (a) Weight of DSS-exposed GF WT mice colonized with microbiota from WT (WT→GF) or Card9−/− (Card9−/−→GF) mice (n = 23 per condition). Data are mean ± s.e.m. of four experiments. (b) Representative H&E-stained images (of three experiments) of mouse proximal colon samples (left) and mouse histological scores at day 12 (right). Data are representative of three experiments. Scale bars, 200 μm. (c,d) Representative immunohistochemistry images (of three experiments) for Ki67 (top) and cleaved caspase-3 (bottom) staining in proximal colon samples from WT→GF (left) and Card9−/−→GF (right) mice (c) and quantification of Ki67 and cleaved caspase-3 staining in the proximal colon at day 12. Data are representative of three experiments. Scale bars, 200 μm. (e) Comparative analysis (left) and heat map (right) of the gene expression in the colons of WT→GF or Card9−/−→GF mice on day 12, using NanoString. (f) Transcript expression in the colon of WT→GF or Card9−/−→GF mice. (g) Secreted IL-22 (left) and IL-17A (right) amounts by MLN cells from WT→GF or Card9−/−→GF mice. (h) Secreted IL-22 (left) and IL-17A (right) amounts by colon explants from WT→GF or Card9−/−→GF mice. ND, not detected. (i) Quantification of IL-22+ cells isolated from the lamina propria of the colon of WT→GF and Card9−/−→GF mice on day 12. Cells were gated for TH22 cells, NKp46+ ILCs, LTi cells, and CD3−CD4−NKp46− cells (n = 5 mice per group). Throughout, data are mean ± s.e.m. *P < 0.05, **P < 0.01, ***P < 0.001; by two-tailed Student’s t-test (a,b,d,g,h,i) and Mann–Whitney U-test (f). In b–h, n = 5 mice per group (days 0 and 7) and n = 10 mice per group (day 12).

