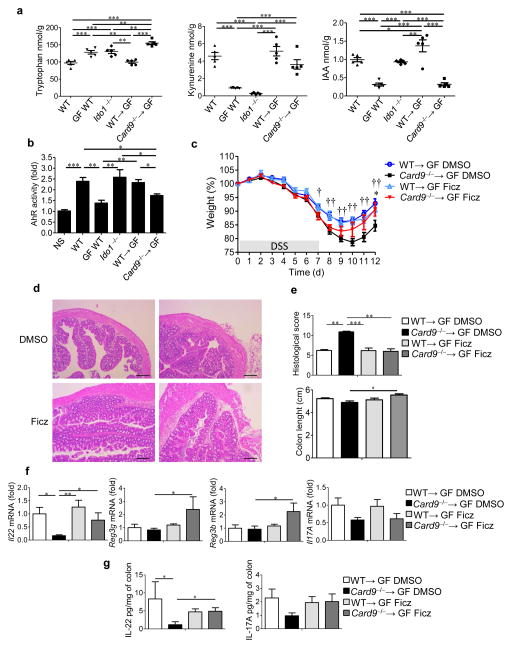
Figure 4.
Tryptophan metabolism is impaired in the gut microbiota of Card9−/− mice, leading to defective AHR activation and colitis recovery. (a) Tryptophan (left), kynurenine (middle), and IAA (right) concentrations in the feces of WT, GF WT, Ido1−/−, WT→GF or Card9−/−→GF mice (n = 5 mice per group). (b) Quantification of AHR activity from fecal samples of the indicated mice (n = 5 for GF WT and Ido−/− mice; n = 12 mice for all other groups). NS, not stimulated. (c) Weight of DSS-exposed mice that were treated with DMSO or Ficz. For statistical comparisons, dagger (†) indicates WT→GF DMSO versus Card9−/−→GF DMSO, and asterisk (*) indicates Card9−/−→GF DMSO versus Card9−/−→GF Ficz. (d) Representative H&E-stained images of proximal colon cross-sections from WT→GF (left) and Card9−/−→GF (right) mice at day 12 that were treated with DMSO (top) or Ficz (bottom). Scale bars, 200 μm. (e) Histological scores (top) and length (bottom) of the colons of the indicated mice at day 12. (f) Transcript expression in the colons of the indicated mice at day 12. (g) Secreted IL-22 (left) and IL-17A (right) amounts by colon explants from the indicated mice at day 12. Throughout, data are mean ± s.e.m. *P < 0.05; ** P < 0.01; ††P < 0.01; *** P < 0.001; by one-way ANOVA and post hoc Tukey test (a–c) or Kruskal–Wallis test followed by a post hoc Dunn’s test (e–g). In c–g, n = 11 DMSO-treated WT→GF mice per experiment; n = 12 DMSO-treated Card9−/−→GF mice per experiment; n = 9 Ficz-treated WT→GF mice per experiment; n = 6 Ficz-treated Card9−/−→GF mice per experiment.

