Figure 5.
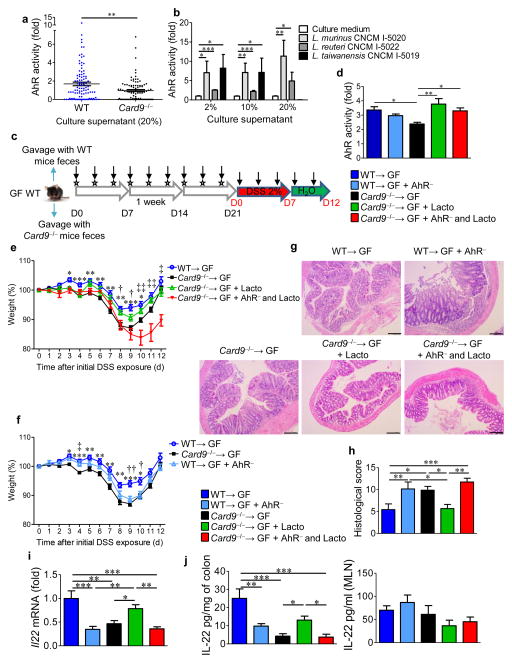
Inoculation with lactobacilli that metabolize tryptophan and produce AHR ligands reduces colitis in an AHR-dependent manner. (a) AHR activation by culture supernatants from strains isolated from feces of WT and Card9−/− mice, relative to that culture media (n = 3 replicates for each strain). (b) AHR activation by culture supernatants from L. murinus CNCM I-5020, L. reuteri CNCM I-5022, and L. taiwanensis CNCM I-5019 isolated from feces of WT mice, relative to that by culture medium alone (n = 3 replicates for each strain). (c) Experimental design of AHR antagonist treatment and Lactobacilli inoculation. Vertical arrows indicate injections of vehicle or AHR antagonist. Stars indicate intragastric gavage with PBS or bacterial suspension. D, day. (d) AHR activation by day 21 feces from WT→GF, Card9−/−→GF, or WT→GF mice treated with an AHR antagonist (WT→GF + AHR−), and Card9−/−→GF mice gavaged with L. murinus CNCM I-5020, L. reuteri CNCM I-5022, and L. taiwanensis CNCM I-5019 isolated from feces of WT mice and treated with either vehicle (Card9−/−→GF + Lacto) or an AHR antagonist (Card9−/−→GF + AHR− and Lacto). (e) Weight of DSS-exposed mice. For statistical comparisons, asterisk (*) indicates WT→GF versus Card9−/−→GF; dagger (†) indicates Card9−/−→GF versus Card9−/−→GF + Lacto; double dagger (‡) indicates Card9−/−→GF + Lacto versus Card9−/−→GF + AHR− and Lacto. (f) Weight of DSS-exposed mice. For statistical comparisons, asterisk (*) indicates WT→GF versus Card9−/−→GF; dagger (†) indicates WT→GF versus WT→GF + AHR−; double dagger (‡) indicates Card9−/−→GF versus WT→GF + AHR−. (g) Representative H&E-stained images of proximal colon cross-sections at day 12 after initial DSS exposure. Scale bars, 200 μm. (h) Histological scores at day 21. (i) Il22 expression in the colon. (j) Secreted IL-22 amounts by colon explants and MLN cells. Throughout, data are mean ± s.e.m. *P < 0.05; †P < 0.05; ‡P < 0.05; **P < 0.01; ††P < 0.01; ‡‡P < 0.01; ***P < 0.001, by Mann–Whitney U-test (a), two-tailed Student’s t-test (b), or one-way ANOVA with post hoc Tukey test (d–f, h–j). In d–j, n = 5 mice per group per experiment.

