
Figure 3.
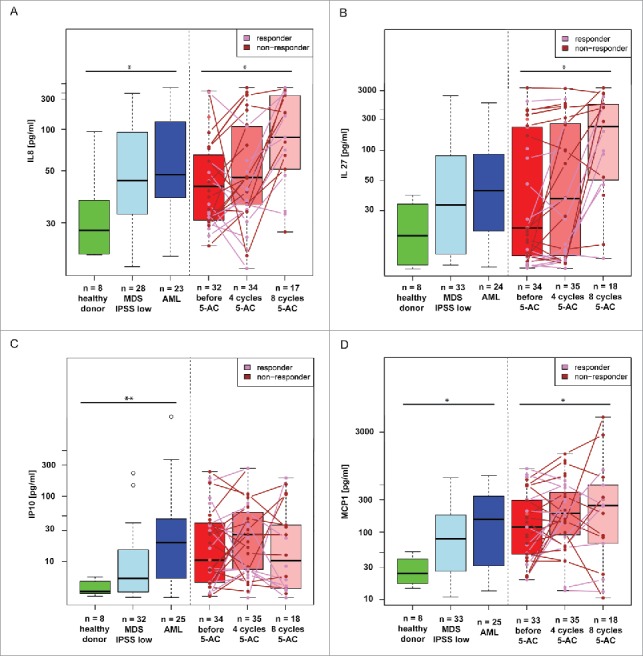
Changes in IL8, MCP1, IP10 and IL27 in BM of MDS patients during therapy with 5-AC. The box plot graphs demonstrate the upper and lower quartiles, and the median is represented by a short black line within the box for each group. The empty circles represent measurements for individual patients whose measured values were numerically distant from the other measurements (outliers; outside 1.5 times the interquartile range above the upper quartile and below the lower quartile). The changes of cytokine values among the individual 5-AC-treated patient (n = 38) are depicted as colored dots of either pink for responders (n = 20) or dark red for non-responders connected by the lines of the same color. Kruskal–Wallis ANOVA compared the changes among the cytokine values of healthy donors, AML patients and low-risk MDS (IPSS low) with the following results: IL8, p = 0.041 (A); IL27, p = 0.07 (B); IP10, p = 0.002 (C) and MCP1, p = 0.018 (D). The robust linear mixed effects model analysis compared changes in cytokine values in repeated samples of 38 5-AC-treated patients and showed the increase during 5-AC therapy when compared to initial values before therapy for IL8, p = 0.01 (A); IL27, p < 0.01(B); MCP1, p < 0.01 (D); but not for IP10, p = 1.00 (C).