
Figure 3.
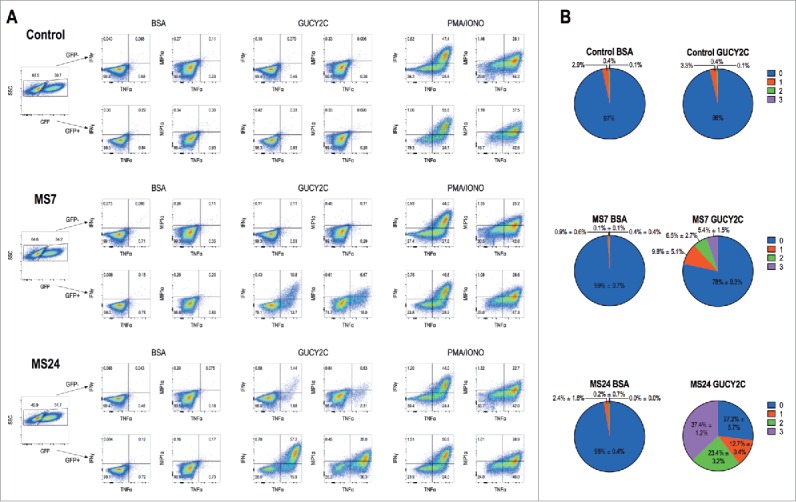
GUCY2C-specific CARs mediate cytokine production. 1 × 10⁶ CAR-expressing T cells were stimulated for 6 h with plate-coated antigen (BSA or GUCY2C) or PMA and Ionomycin (PMA/IONO) in the presence of protein transport inhibitor. Cells were fixed, permeabilized, and stained for the intracellular cytokines IFNγ, TNFα, or MIP-1α and analyzed via flow cytometry. (A) Plots are gated on live GFP- (top) or GFP+ (bottom) CD8+ T cells. (B) Polyfunctional cytokine graphs depict the percentages of CAR-T cells producing 0, 1, 2, or 3 cytokines. Plots in (A) are representative of two experiments, and polyfunctional cytokine analysis (B) represent means ± standard deviation of two experiments.