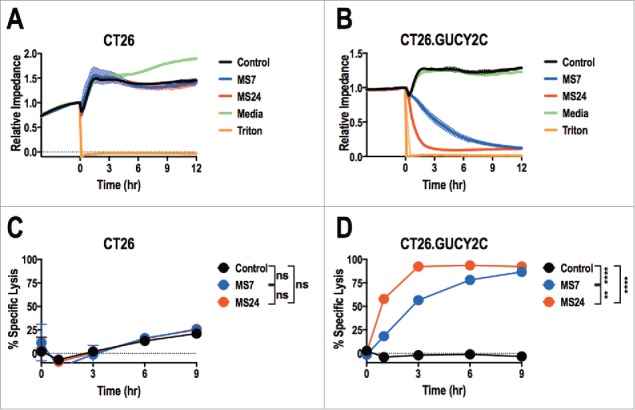
Figure 4.

Real-time GUCY2C-specific CAR T cell-mediated cytotoxicity. CT26 (A and C) or CT26.GUCY2C (B and D) mouse colorectal cancer cells were seeded at 10,000 cells/well in an E-Plate and CAR-T cells, media, or Triton-X 100 (Triton) were added to the plate 24 h later (time = 0). The E-Plate was scanned every 15 min to quantify relative electrical impedance (normalized to time = 0). (A and B) Solid lines indicate the mean of duplicate wells and surrounding clouds indicate standard deviation. Results are representative of two experiments. (C and D) % specific lysis values for each CAR-T cell and target cell combination were calculated from the impedance data at the indicated time points. All statistical tests in (C) and (D) compared (1) Control to MS7, (2) Control to MS24, and (3) MS7 to MS24 (**p < 0.01, ****p < 0.0001, Two-way ANOVA). (C and D) show the means ± standard deviation of two experiments.
