
Figure 5.
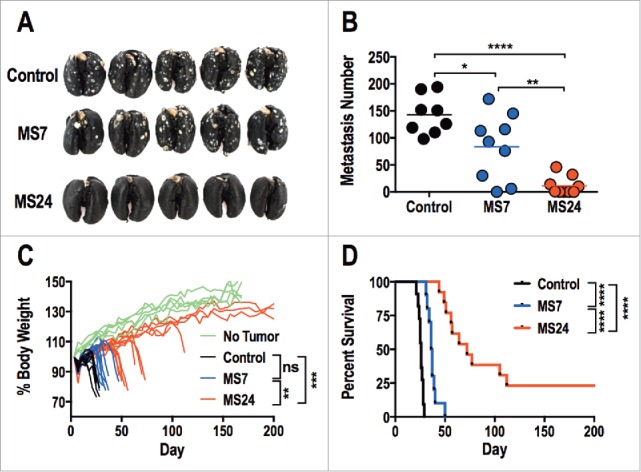
GUCY2C-specific CAR T cells oppose parenchymal colorectal cancer metastases. (A–D) BALB/c mice were injected i.v. with 5 × 10⁵ CT26.GUCY2C cells to establish lung metastases. On day 3, mice received a dose of 5 Gy TBI followed by an i.v. injection of ˜1 × 10⁷ CAR-T cells. Mice were sacrificed on day 24 after tumor inoculation, lungs were stained with India ink, and tumor nodules were counted (A and B), or mice were followed longitudinally for morbidity (C) and survival (D). (A) Representative images of lungs collected and stained on day 24. (B) Quantification of metastases in each mouse. (N = 8–9 mice/group; *p < 0.05, **p < 0.01, and ****p < 0.0001, One-way ANOVA). (C) Body weight curves of mice relative to initial body weight indicating progression of cancer cachexia, where each line represents an individual mouse. No Tumor represents curves of unmanipulated mice. (n = 10–13 mice/group; ns = not significant, ** p< 0.01, *** p< 0.001, One-way ANOVA of total area under the curve). (D) Survival analysis (n = 10–13 mice/group; ****p < 0.0001, Mantel-Cox log-rank test). All statistical tests in (B–D) compared (1) Control to MS7, (2) Control to MS24, and (3) MS7 to MS24.