
Figure 2.
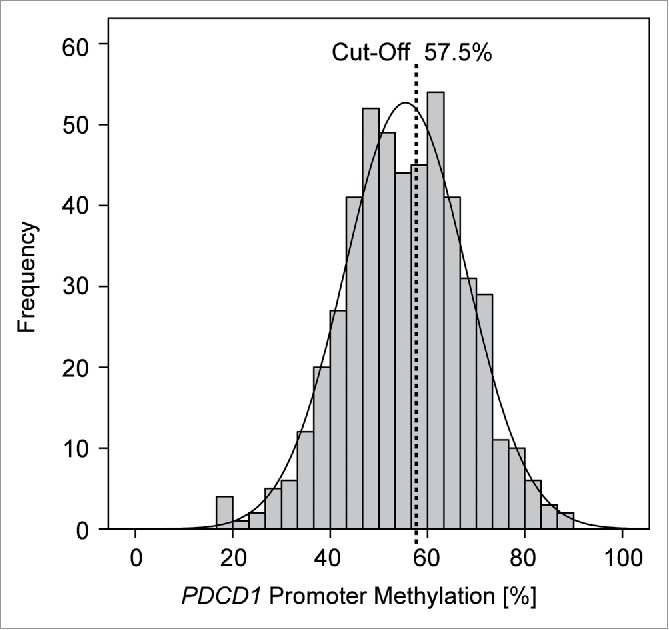
Frequency of PD-1 methylation (mPD-1) in 498 prostate carcinoma samples. PD-1 promoter methylation analysis revealed a symmetric, almost Gaussian distribution (black line) covering a broad spectrum of values (18–88%) with a bifurcation at 55%. An optimal mPD-1 cut-off was elaborated by an iterative approach (57.50%) stratifying patients into PD-1 hyper- (mPD-1high) and hypomethylated (mPD-1low) cases.