Figure 4.
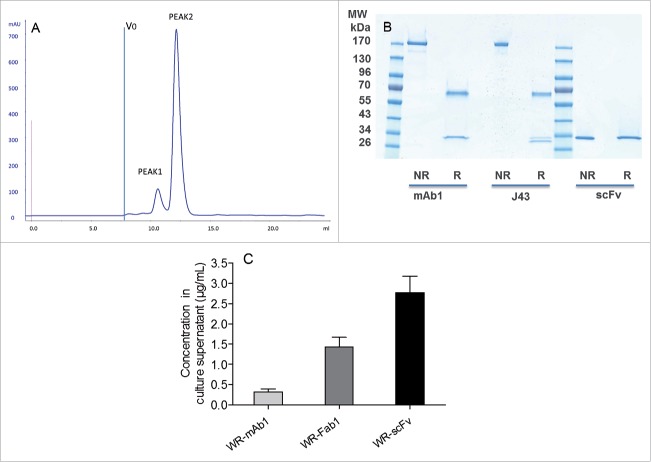
Characterization and quantification of mAb, Fab and scFv purified from supernatants of infected CEF. Size exclusion chromatography profile of scFv after the affinity chromatography step (A). ScFv eluting from the Ni affinity column was pooled and loaded of Superdex 75 10/300 equilibrated in PBS. Absorbance at 280 nm and elution volume were recorded. Area of peak 2 was about 7-fold area of peak 1. V0 is the void volume of the column. SDS-PAGE profiles of purified recombinant mAb1 and scFv in reducing and non-reducing conditions (B). 1 µg of purified recombinant mAb1 and scFv were loaded on SDS-PAGE in reducing (R) and non-reducing (NR) conditions. J43 (BioXcell) was loaded as reference in the case of mAb1. Quantification of mAb, Fab and scFv in supernatants of the infected cells (C). Supernatants of infected CEF were recovered 48 h after infection and loaded on stain-free SDS-PAGE together with corresponding purified and quantified molecules as standards. Fluorescence intensity of the bands of interest was measured for each supernatant. Quantity of produced protein was determined using the fluorescence of standards as reference. Represented values are the mean (+/− standard deviation) of three measurements.

