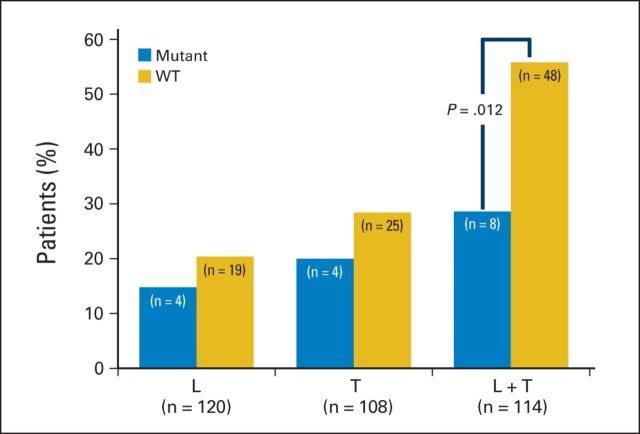
Fig 3.
Influence of PIK3CA mutation on pathologic complete response (pCR) by treatment arm. The proportion of patients who obtained total pCR is shown for each treatment arm, separated based on the PIK3CA mutation status. The total number of patients in each group is shown (gold, PIK3CA wild type [WT]; blue, PIK3CA mutant). In each of the bar graphs the number of patients is being displayed. The total number of patients with available pCR data in each group is shown. L, lapatinib; T, trastuzumab.

