
Figure 7.
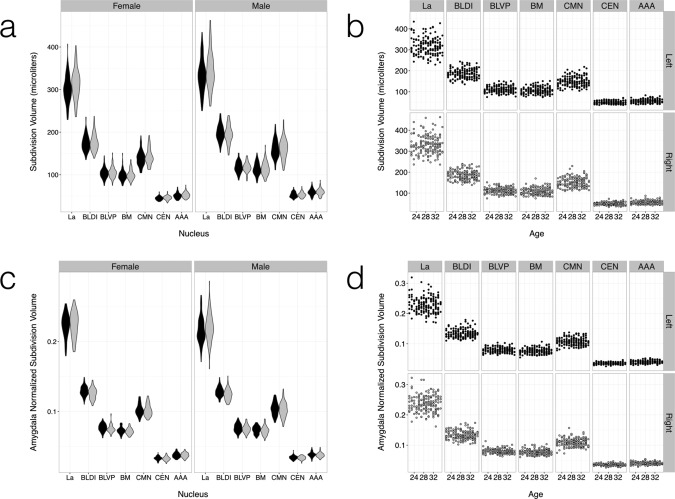
Group distributions of absolute and normalized volumes for the seven largest amygdala subdivisions over all individuals (a,c). The subdivision volumes follow the same trends observed in the total amygdala volume (Fig. 7), with group sex differences vanishing after normalization (c,d) and no age effect (b,d). Results for the left and right amygdalae are in dark gray and light gray, respectively. Linear models are overlaid with 95% confidence intervals in the volume versus age graphs. See Tables II and III for statistical summaries.