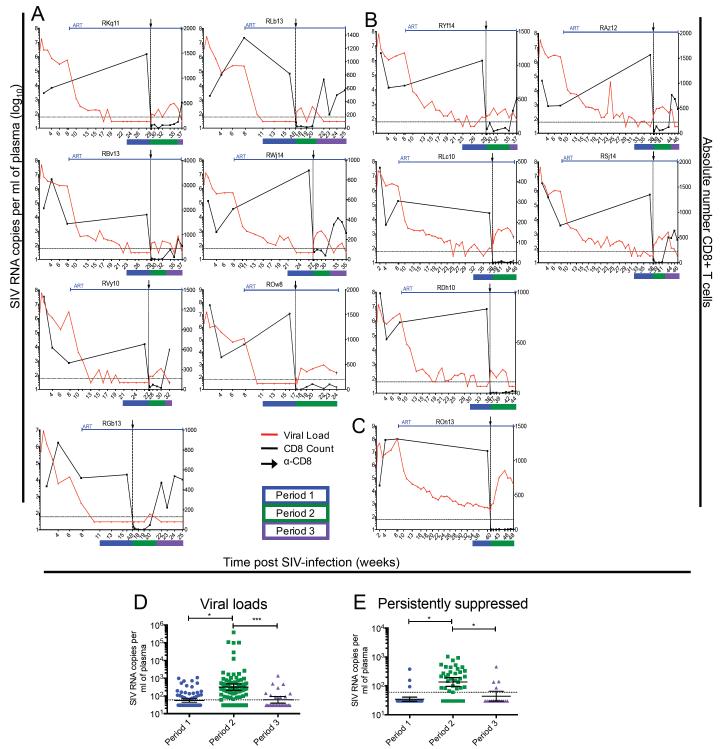
Figure 2. CD8 depletion results in increased plasma viremia in ART-treated SIV-infected RMs.
Viral load (red) and CD8+ T cell counts (black) of SIV-infected RM that were (A) persistently suppressed, (B) intermittently suppressed, and (C) never fully suppressed on ART. Black arrow and dotted vertical line indicate anti-CD8 antibody MT-807R1 administration. (D) Geometric mean viremia for each statistical period for 13 RM. (Described fully in Table S3). Bars show the geometric mean with 95% CI, *p< 0.05, ***p<0.001. (E) Geometric mean viremia for each statistical period for 7 persistently suppressed RM. Bars show the geometric mean with 95% CI, *p <0.05. Statistical analysis was conducted using a linear, mixed effects model.

