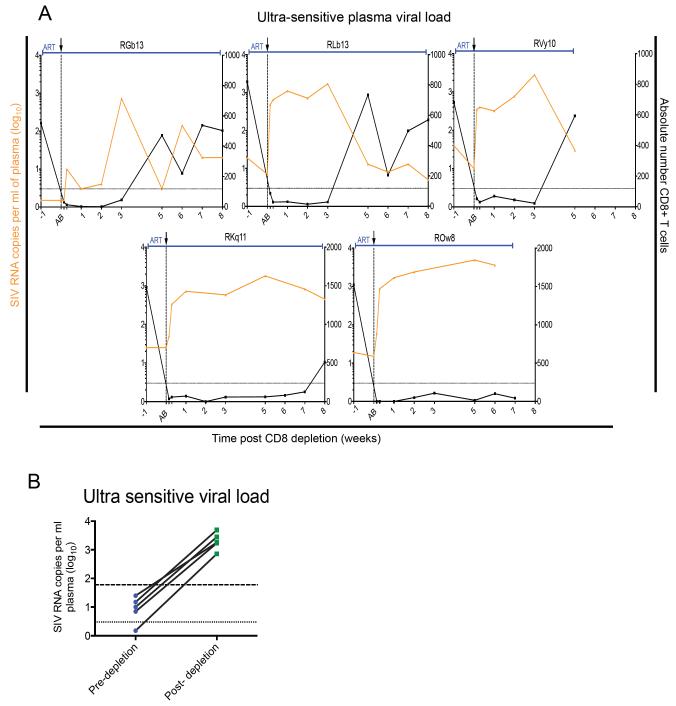
Figure 4. Ultrasensitive viral load assay confirms the increase in viremia post-CD8 depletion.
(A) Viral load (orange) and CD8+ T cell counts (black) of SIV-infected RM that were persistently suppressed. Shaded area represents ART period. Black arrow and dotted vertical line indicate anti-CD8 antibody MT-807R1 administration. (B) Pre-depletion and peak post-depletion viremia (log10) for 5 RM. Dotted line is limit of detection of ultrasensitive viral load assay (3 copies/ml plasma). Dashed line is limit of detection of standard viral load assay (60 copies/ml plasma). Paired t-test, *p< 0.05.

