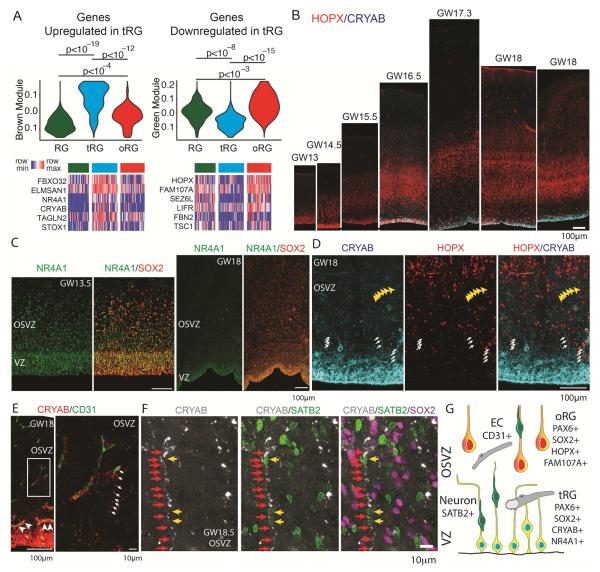
Figure 2. Molecular Identity of Truncated Radial Glia.
(A) Violin plots represent distribution of module eigengene values for gene correlation networks upregulated in tRG (module “brown”) and specifically downregulated in tRG cells (module “green”), across previously published single cell RNA-Seq datasets generated for 39 GW14-15 radial glia (RG), 48 GW16-18 tRG cells (previously referred to as vRG cells), and 46 GW16-18 oRG cells (Camp et al., 2015; Pollen et al., 2015). Heatmaps show normalized expression values of representative members of both modules across single cells (see also Supplementary Table 1 for gene module assignments and information about the number of cells of in each class). p-values were calculated using two-way Student t-test. (B) Staining of primary tissue sections for the oRG marker, HOPX and a tRG marker, CRYAB, showing rapid onset of CRYAB expression at around GW16.5. (C) NR4A1 expression is enriched in the VZ during early stages of cortical development and in tRG cells. (D) Representative high magnification image of CRYAB and HOPX immunostaining in the germinal zone. Arrows indicate CRYAB positive tRG fibers and yellow arrowheads indicate an example of a tangentially oriented CRYAB positive fiber consistent with the late tRG fiber morphologies shown in Figure 1. (E) Immunostaining of human germinal zone revealing association of tRG fibers with blood capillaries. Arrowheads indicate examples of CD31-positive endothelial cells surrounded by CRYAB immunostaining of tRG cells. Arrows in the magnified image from the OSVZ highlight an example of a tRG fiber reaching a blood capillary. (F) Representative example of a CRYAB positive tRG fiber in a GW18.5 sample. Red arrows highlight a CRYAB positive fiber and yellow arrows indicate SATB2 positive neuronal cell bodies juxtaposed to the tRG fiber. See also Figure S3 for an example from a GW18.2 specimen. (G) Proposed features of tRG cells include truncated morphology of the basal fiber, distinct molecular identity, and frequent association with blood vessels (EC – endothelial cell).

