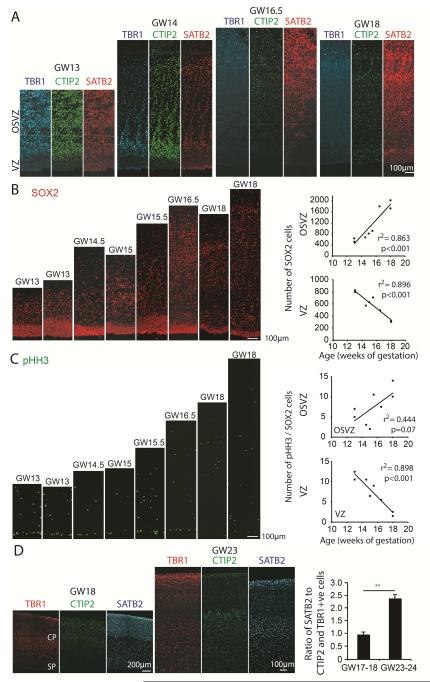
Figure 3. Expansion of Supragranular Layers During the Discontinuous Stage of Cortical Development.
(A) Immunohistochemical detection of newborn neurons in the cortical germinal zone using antibodies for cortical layer markers. (B,C) Immunolabeling and quantification of the total number of SOX2+ cells. (B) SOX2+ cells and phosphorylated Histone H3 and SOX2 double-positive cells (C), in the VZ and OSVZ between GW13 and GW18. The non-linear increase in oRG cell mitoses may reflect dynamic changes in cell cycle parameters over the course of cortical development (Betizeau et al., 2013; Takahashi et al., 1993). Scatter plots represent quantification results of average total number of immunopositive cells for each primary tissue sample shown in the overlying images. Each data point represents a distinct biological replicate, and the quantification was performed in two randomly selected non-adjacent tissue sections, as outlined in Experimental Procedures. Statistical significance was evaluated using linear regression test with p-values displayed above the graph. (D) Left and middle panels show representative examples of immunohistochemical detection of cortical projection neurons around GW18 (left) and GW24 (middle) using antibodies against markers of laminar identity TBR1, CTIP2 (expressed in deep layer neurons), and SATB2 (expressed in upper layer neurons). Quantification of neuronal populations at GW17-18 (n=3, quantification included cortical plate CP and regions containing migrating neurons, IZ and subplate, SP) and at GW 23-24 (n=3). ** - p<0.01, Student’s t-test. Error bars represent s.e.m.

