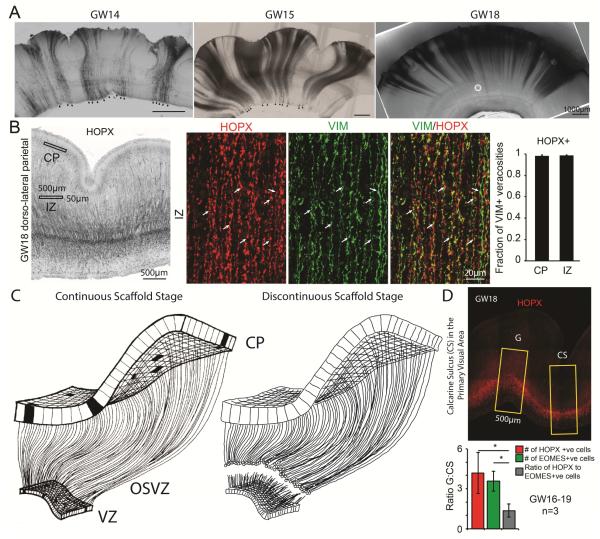
Figure 4. Radial Glia Scaffold Reaching the Cortical Plate During Supragranular Layer Neurogenesis is Formed by oRG Cells.
(A) DiI labeling of pia contacting cells throughout human neurogenesis. Consistent with the proposed model, no back-labeled of ventricle contacting cells (arrowheads in left and middle panel) are observed after GW16.5. Note that any apparent folding of the tissue may represent tissue processing artifacts. (B) Validation of cell identity of radial glia fibers in the intermediate zone (IZ) and the cortical plate (CP) using immunohistochemistry. Left image shows representative immunostaining for HOPX, while panels show high magnification example of a fraction of a counting area in the IZ. Arrows indicate varicosities double positive for the pan radial glia marker, VIM, and the outer radial glia marker, HOPX. Quantification represents n=4 (GW17-18.5) biological replicates, error bars represent s.e.m. (C) Two stages of human cerebral cortex development during neurogenesis. Left panel with permission from (Rakic, 2003a). (D) Representative example of HOPX immunostaining of a tissue section through the calcarine sulcus (“CS”) and the adjacent gyrus (“G”) for the oRG marker, HOPX. Quantification was performed in three biological replicates (GW16, GW18, and GW19), total numbers of HOPX and EOMES immunopositive cells in the OSVZ was quantified across two randomly selected non-adjacent tissue sections, as outlined in Experimental Procedures. Bar graph represents the average ratios of OSVZ oRG cells (red bar), IPCs (green bar), and a relative abundance of oRGs to IPCs (gray bar) between the gyrus and the calcarine sulcus. * - p<0.05, paired Student’s t-test. Error bars represent s.e.m.

