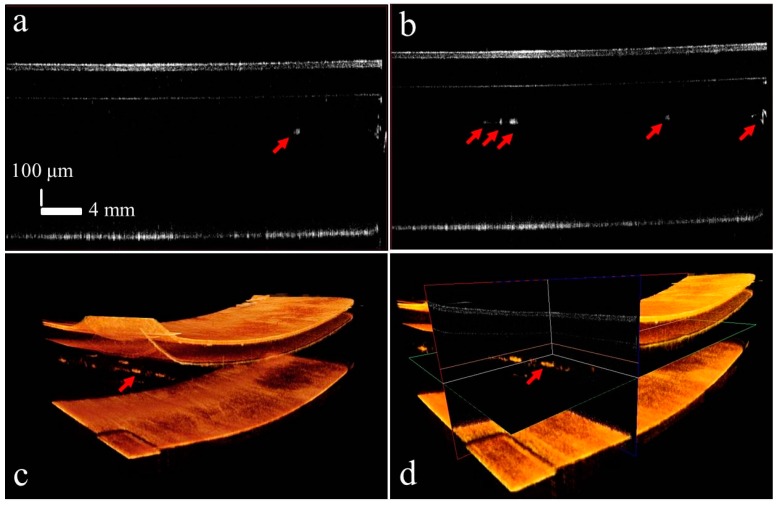
Figure 8.
Results of sample head-2 of the SD-OCT-2 system with defects identified with red arrows: (a) cross-sectional view of single-point defect in the glass layer; (b) multiple defects in the glass layer; (c) 3D scan result showing multiple defects in the glass layer; (d) ortho-sliced view of defect.

