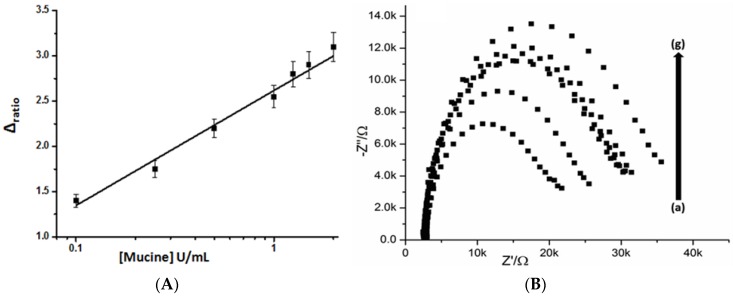
Figure 6.
The calibration curve corresponding to the detection of mucine based on changes of electron-transfer resistance (Ret), which presented as ∆ ratio (A) Nyquist plots of mucine-aptamer modified SPCEs with different concentrations of mucine U/ml (a) 0.1 (b) 0.25 (c) 0.5 (d) 1 (e) 1.25 (f) 1.5 and (g) 2 (B).

