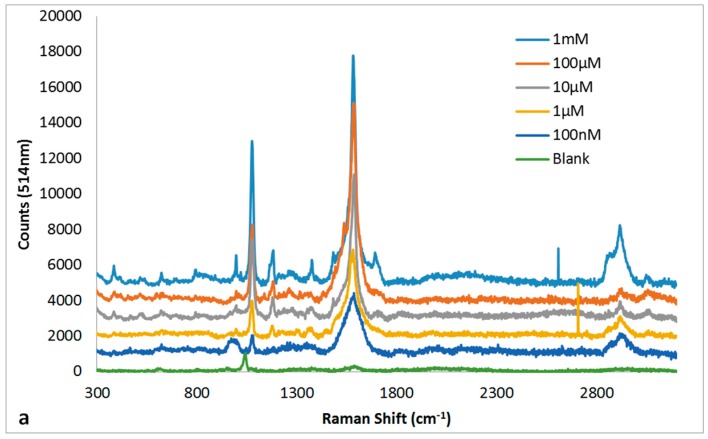
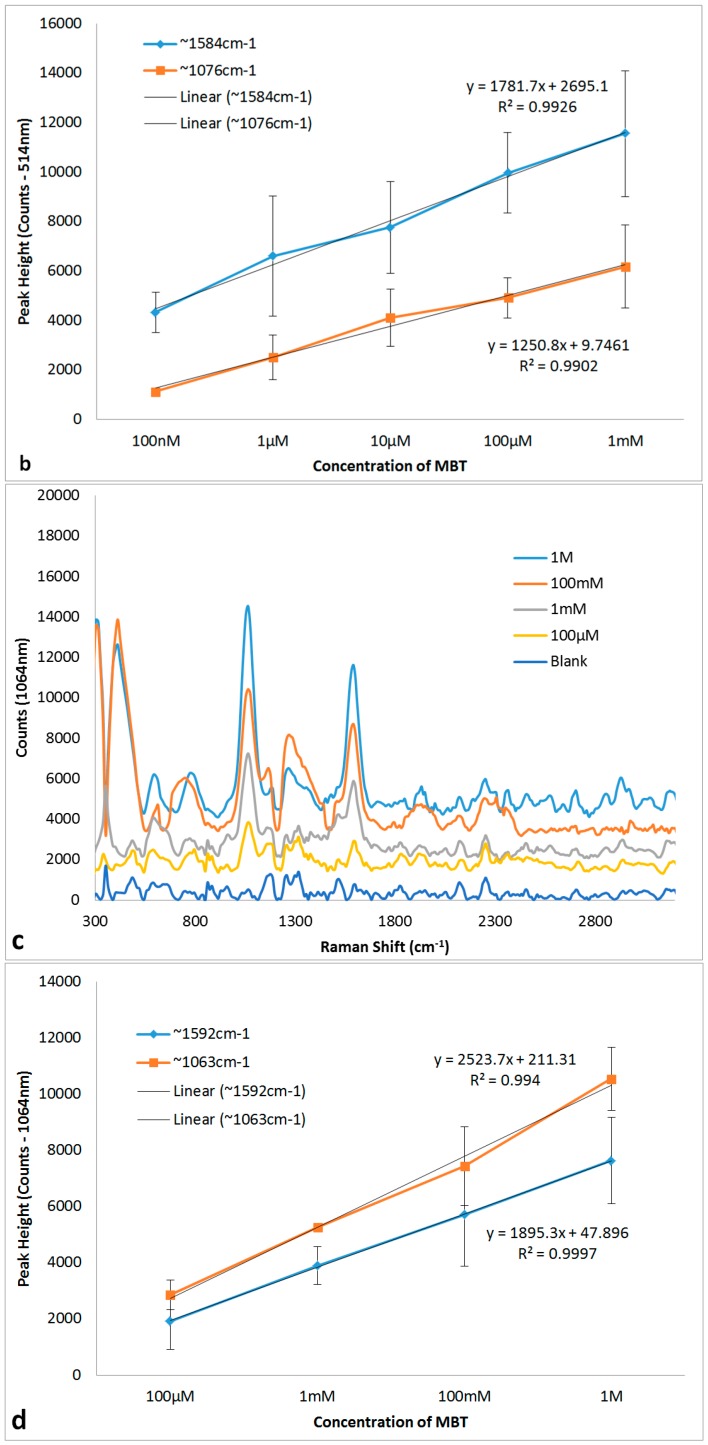
Figure 8.
SERS spectra for MBT (a,c) as a function of concentration and their corresponding standard curves for the peaks ~1076 cm−1 and ~1584 cm−1 (b,d) recorded using 514 nm (a,b) and 1064 nm (c,d) Raman spectrometers. The SERS spectra (a,c) are offset by 1000 cm−1 for clarity. The peak heights (b,d) are presented as mean ± standard error of mean (n = 6).


