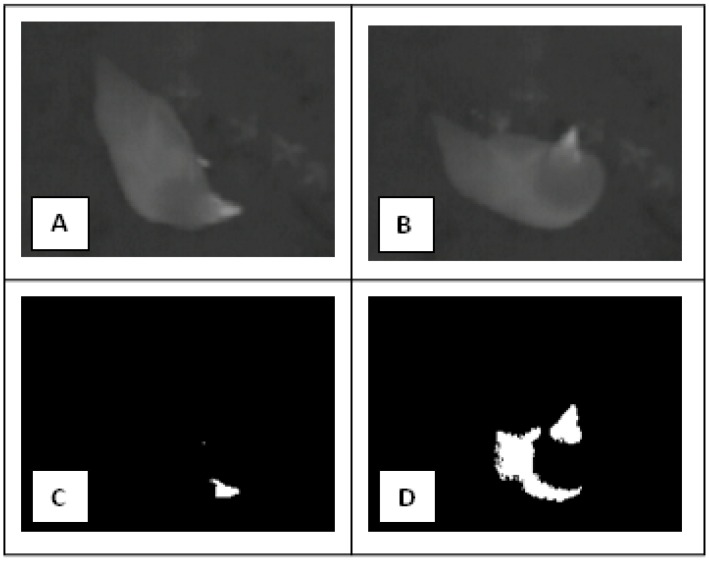
Figure 4.
Pictures (A,B) are examples of the thermographic images collected during the experiment, while pictures (C,D) are examples of the elaborations performed by the monitoring system under study. In details, picture (C) is the result of the elaboration performed having as input the picture (A) while picture (D) is the result of the elaboration performed having as input the picture (B). In picture (C), the number of colored pixels (CP) is 113 while in picture (D), the number of CP is 1832. Therefore, considering a cutoff threshold of 196 pixels (“hens detected” threshold), picture (C) is an example of a false negative case while picture (D) is an example of a true positive case.

