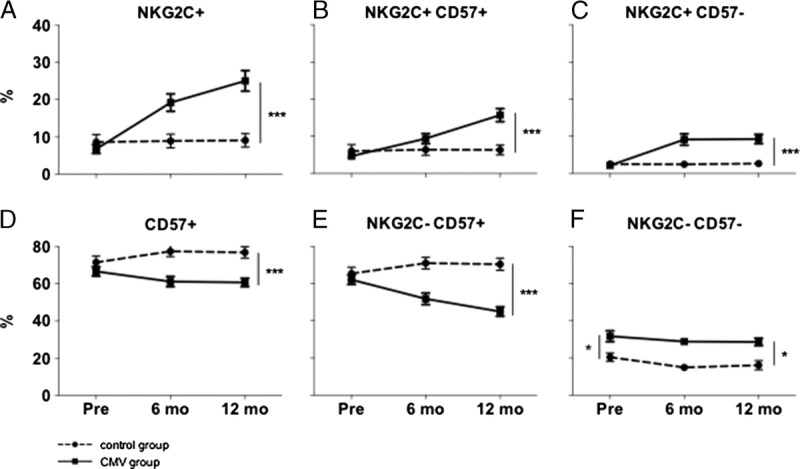
FIGURE 2.

Changes in expression of different surface molecules. Full lines depict CMV group (n = 42), dotted lines depict control group (n = 22). Numbers are percent of all CD56dim NKG2A− NK cells. A, NKG2C expressing NK cells increase significantly after CMV infection. B, NKG2C and CD57 coexpressing cells increase in the CMV group, the same is true for NKG2C+CD57− cells (C). D, Decrease in CD57 expressing cells after CMV infection. E, The increase of NKG2C+ cells is going at the expense of the CD57+NKG2C− subpopulation, which decreases after CMV infection. F, A significant difference between control group and CMV group in the NKG2C−CD57− fraction is observed. Since this can already be observed before CMV infection, this difference cannot be attributed to CMV infection.
