
FIGURE 3.
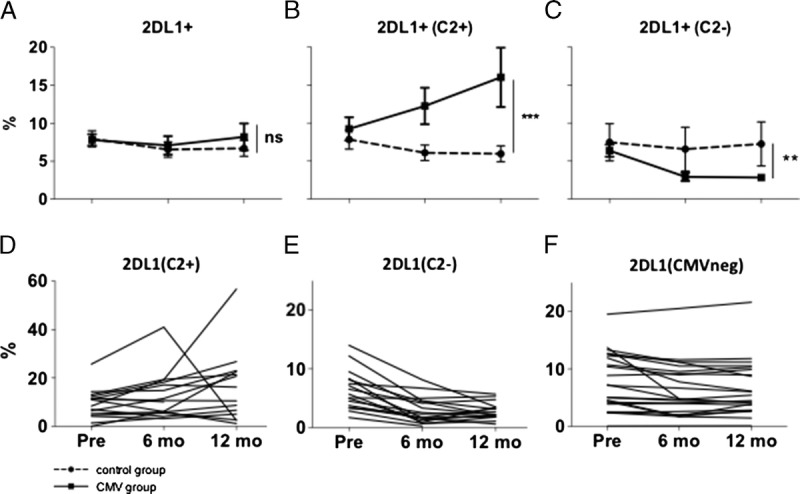
Changes in surface expression of 2DL1. Full lines depict CMV group (n = 42), dotted lines depict control group (n = 22). Numbers are percent of all CD56dim NKG2A− NK cells. A, Overall, cells expressing KIR2DL1 as the only inhibitory KIR do not change after CMV infection compared to the control group. B, In the presence of the cognate ligand HLA C2, there is a significant increase in 2DL1 expressing cells, whereas in absence of the cognate ligand, 2DL1 expressing cells decrease (C). D-F, Pattern of change in 2DL1 expression in single patients. D, CMV group, HLA-C2 positive samples (n = 16). E, CMV group, HLA-C2 negative samples (n = 17). F, Control group (n = 22).