
FIGURE 4.
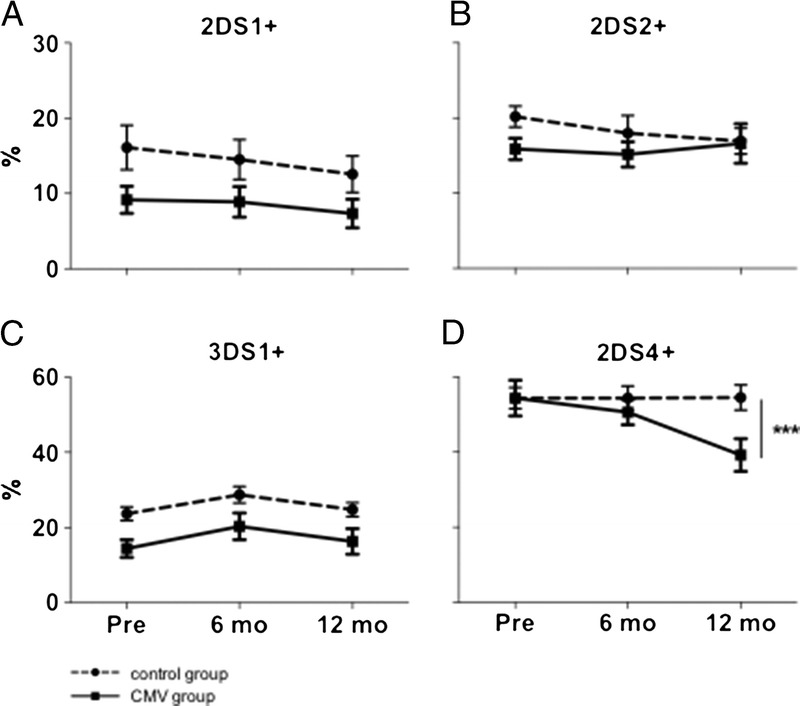
Changes in surface expression of different activating KIR. Full lines depict CMV group (n = 42), dotted lines depict control group (n = 22). A-C, No significant changes in subpopulations expressing KIR2DS1, 2DS2 or 3DS1 respectively. D, The subpopulation expressing 2DS4 decreases significantly after CMV infection.