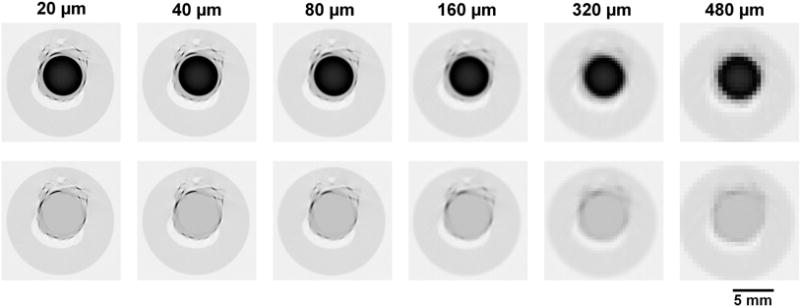
Figure 3.

Micro-CT cross-sectional images of the injected artery shown in inverse gray scale to facilitate visualization. Black is highly attenuating and white is air. The upper row shows the same, Microfil® containing artery lumen, cross section reconstructed from the increasingly larger detector pixels from left to right. The lower panels show the micro-CT images after the Microfil® in the artery lumen was “removed” as described in the text.
