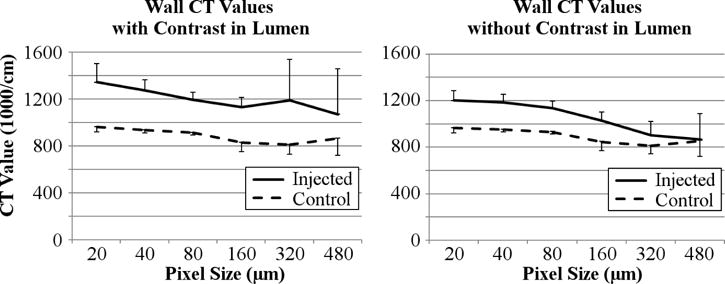
Figure 4.

Left panel shows increased micro-CT value of the carotid artery wall region in the ‘injected’ artery wall and in the ‘control’ artery wall at different CT detector pixel sizes (and corresponding CT image voxel sizes). Right panel – same as left panel after the lumen opacity was replaced by background CT values. The vertical bars are standard deviation about the mean computed for the 28 contiguous slices.
