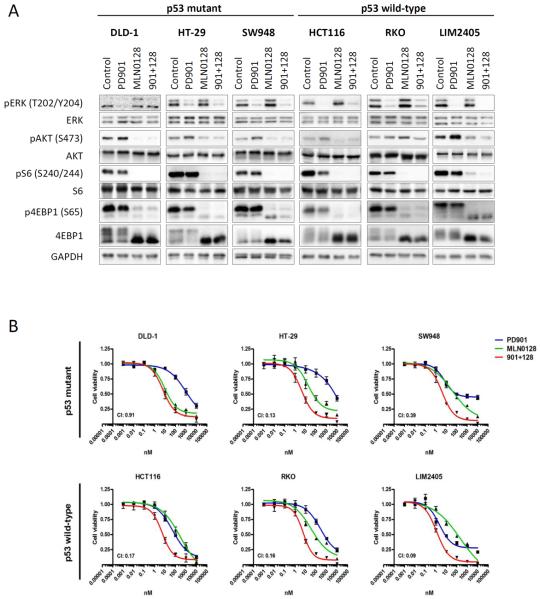
Figure 1. MEK- and mTOR-inhibition suppress pathway activation and proliferation irrespective of p53 mutational status.
A. The indicated CRC cell lines were treated with DMSO (Control), 50 nM PD901, 50 nM MLN0128 or the combination of both inhibitors (901 + 128). Whole-cell protein extracts were analyzed by Western blotting with the indicated antibodies. ERK antibody was used as loading control. Figures are representative of three independent experiments. B. The indicated CRC cell lines were treated with 1:10 serial dilutions of PD901, MLN0128 or the combination. Proliferation was measured after 4 days of treatment with a cell viability assay (Cell Titer-Glo, Promega). Proliferation curves were graphed using GraphPad Prism software. Combination index (CI) was calculated using CompuSyn computer software (Fa=0.5). Data are expressed as mean ± SE from 3 independent experiments.

