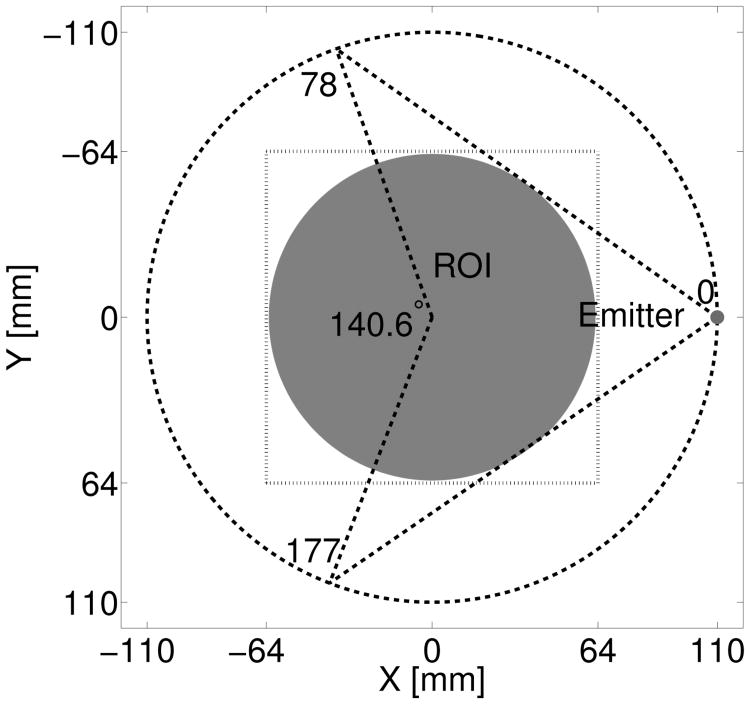
Fig. 1.
Schematic of a USCT system with a circular transducer array whose elements are indexed from 0 to 255. It shows the first data acquisition, where element-0 (in red) is emitting an acoustic pulse, while all 256 elements are receiving signals. The region-of-interest (ROI) is shaded in gray, and the dashed square box represents the physical dimensions (128 × 128 mm2) of all reconstructed images.

