Fig. 5.
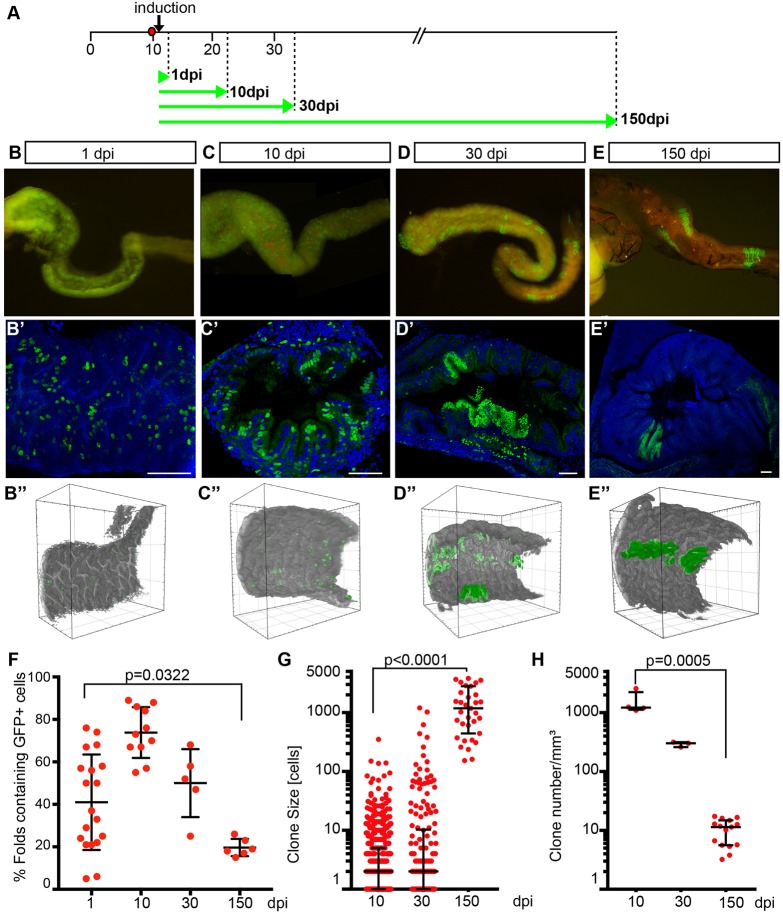
Clonal analysis in the GaudíRSG line indicates symmetric cell division in the medaka intestine. (A) Experimental timeline. Double transgenic fish GaudíRSG-ubiquitin:ERT2Cre were used with an inducible Cre recombinase that triggers a shift in reporter colour and localization. Cre-mediated recombination of GaudíRSG construct was triggered at larval stage by tamoxifen treatment (5-10 µM, 3 h). Green arrows indicate time point of imaging and analysis of the intestine after induction. (B) Whole mount representation (macroscope) of dissected intestines at different time points (B) 1 day (C) 10 days (D) 30 days (E) 150 days post induction. (B′-E′) Confocal images of intestinal sections of corresponding fish showing labelling of discrete, single cells at 1 dpi, larger clonal strings extending from bottom to top of folds (10 dpi) and coverage of entire folds with descendants of individual recombined (or non-recombined, 30 dpi, 150 dpi) cells. Each panel represents a 3D projection of 60-100 optical sections (plane=0.5 µm). H2B-GFP, green; DAPI-stained DNA, blue. Scale bars: 50 µm. (B″-E″) MuVi-Spim 3D visualization of gut segments (532 µm) at different time points after induction showing labelling in the context of the organ. (F) GFP+ folds were counted using sections from 19 fish at 1 dpi, 11 fish at 10 dpi, 5 fish at 30 dpi, 6 fish at 150 dpi; unpaired t-test, P=0.0322. (G) Quantification of clone size of intestinal segments shown in B″-E″ at 10, 30, 150 dpi; data are represented at logarithmic scale; Mann–Whitney test, P<0.0001. (H) Clone density per volume (mm3) of intestinal segments shown in B″-E″. Cell numbers were derived from light sheet analyses and are represented at logarithmic scale; Mann–Whitney test, P=0.0005. Black bars indicate mean±s.d. in F and interquartile range in G,H.

