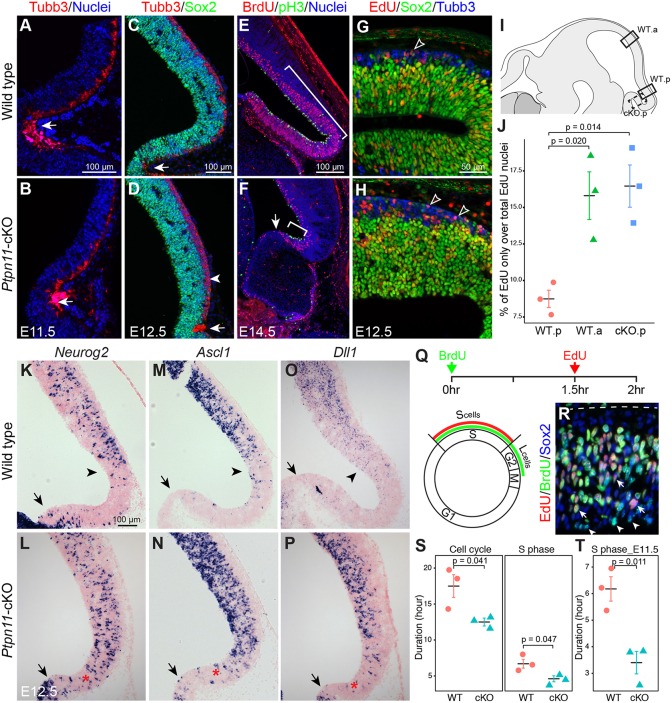
Fig. 4.
Depletion of neural progenitors in the posterior tectum in the absence of Ptpn11. (A-H) Immunofluorescence with the indicated antibodies on sagittal sections. The arrows point to the isthmus; the arrowhead in D indicates the thickened Tubb3+ cell layer; brackets in E and F demarcate the proliferative zone; unfilled arrowheads in G and H denote Tubb3+/EdU+/Sox2− cells that have exited the cell cycle. (I) Schematic of the anterior (WT.a) and posterior (WT.b) areas (boxed) that were analyzed for cell cycle re-entry and cell cycle length. The dashed box indicates the region closer to the isthmus that was examined in Ptpn11-cKO embryos (cKO.p). (J) Quantification of percentage of nuclei expressing EdU only out of total EdU+ nuclei (mean±s.e.m.). Two-tailed unpaired Student's t-test. (K-P) In situ hybridization on sagittal sections of E12.5 midbrain. Arrows indicate the isthmus, arrowheads show the posterior limit of gene expression in wild-type embryos; asterisks denote the abnormal expression in the posterior end of the midbrain. (Q) Schematic illustrating the estimation of cell cycle parameters by double labeling with BrdU and EdU. (R) Immunofluorescence on sagittal sections of the posterior tectum at E12.5. Arrows and arrowheads indicate BrdU+/EdU+ nuclei and nuclei expressing BrdU only, respectively; the dashed line shows the pial surface. (S,T) Quantification of duration of the total cell cycle and S phase at E12.5 (S) and S phase at E11.5 (T) in wild-type (WT) and Ptpn11-cKO embryos. Two-tailed unpaired Student's t-test.

