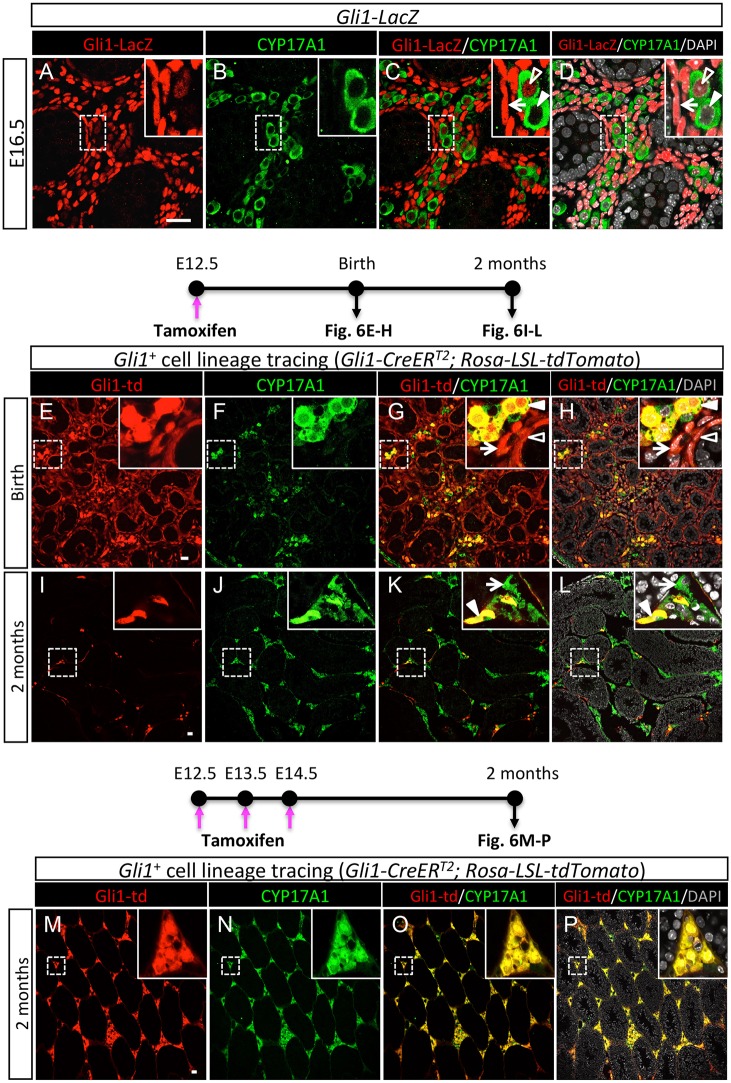
Fig. 5.
Detection of Gli1 in the fetal testis by Gli1-lacZ reporter and genetic lineage-tracing analysis. (A-D) Expression of Gli1-lacZ in the E16.5 fetal testes was detected by fluorescence immunohistochemistry for β-galactosidase (red for Gli1+ cells), the Leydig cell marker CYP17A1 (green), and the nuclear counterstain DAPI (gray). In insets of C and D, arrows point to Gli1+/CYP17A1− non-steroidogenic interstitial cells, unfilled arrowheads indicate Gli1+/CYP17A1+ fetal Leydig cells, and filled arrowheads represent Gli1−/CYP17A1+ fetal Leydig cells. (E-L) Lineage-tracing analysis of the Gli1+ cells in the Gli1-CreERT2; Rosa-LSL-tdTomato embryos was induced by tamoxifen (TM) administration at E12.5. The testes were examined at different stages of development for Gli1-td (red; tdTomato labeled fetal testis-derived Gli1+ cells), the Leydig cell marker CYP17A1 (green), and DAPI (gray). Arrows in G,H insets indicate Gli1+/CYP17A1− interstitial cells, filled arrowheads in G,H insets indicate Gli1+/CYP17A1+ fetal Leydig cells and unfilled arrowheads in G,H insets indicate Gli1+/CYP17A1− peritubular myoid cells. Arrows in K,L insets indicate Gli1−/CYP17A1+ adult Leydig cells, filled arrowheads in K,L insets indicate Gli1+/CYP17A1+ adult Leydig cells. (M-P) Lineage-tracing analysis of the Gli1+ cells in the Gli1-CreERT2; Rosa-LSL-tdTomato embryos was induced by TM administration from E12.5 to E14.5 for three consecutive days. The testes were examined for Gli1-td (red; tdTomato labeled fetal testis-derived Gli1+ cells), the Leydig cell marker CYP17A1 (green), and DAPI (gray). The insets are higher magnifications of the boxed areas. Scale bars: 25 μm.

