
Fig. 3.
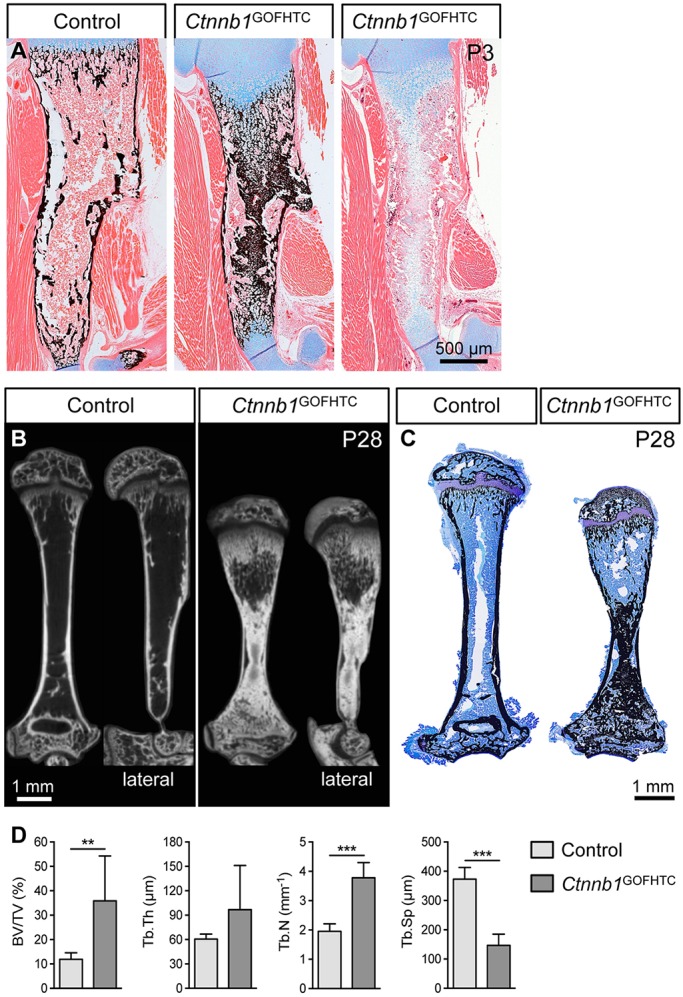
Postnatal phenotypic analysis of Ctnnb1GOFHTC mutants. (A) Representative images of humeri from P3 control and Ctnnb1GOFHTC littermates stained with Alcian Blue/von Kossa or Alcian Blue. (B) MicroCT images of control and Ctnnb1GOFHTC humeri (P28, frontal and lateral view). The lateral view reveals anterior-posterior differences in the trabecular density underneath the proximal growth plate in the mutant humerus. (C) Toluidine Blue/von Kossa-stained sections of control and Ctnnb1GOFHTC P28 humeri. Orientation is proximal up and distal down. (D) Histomorphometric quantification of the bone volume (BV) to total volume (TV) ratio, trabecular thickness (Tb.Th), trabecular number (Tb.N) and trabecular spacing (Tb.Sp) of P28 proximal humeri comparing Ctnnb1GOFHTC (n=8) and littermate controls (n=9). **P<0.01, ***P<0.001. Error bars indicate s.d. Genotype of control is Ctnnb1ex3fl/+;Col10a1-Cre−.