
Fig. 5.
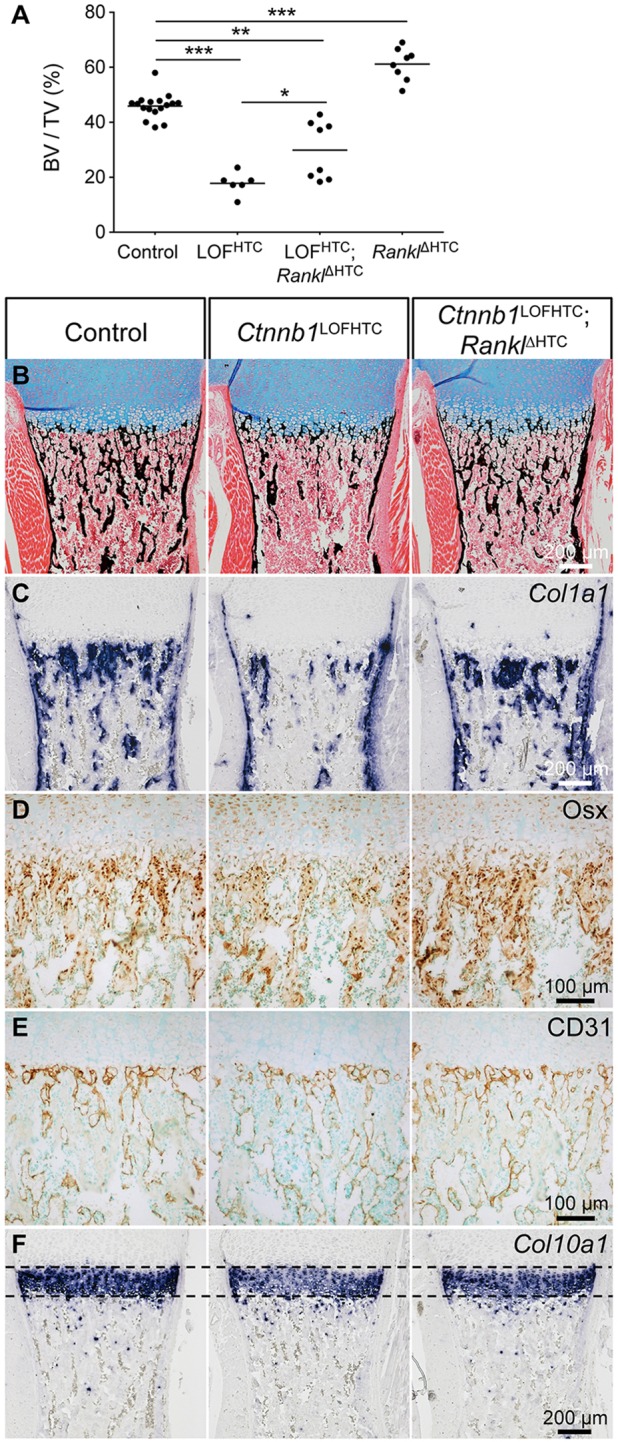
Partial reversal of the Ctnnb1LOFHTC phenotype by conditional deletion of Rankl in HTCs. (A) Scatter plot showing the distribution (and mean) of the bone volume (BV) to total volume (TV) (%) of the different controls (n=17), Ctnnb1LOFHTC (n=6), Ctnnb1LOFHTC;RanklΔHTC (Ctnnb1lacZ/fl;Ranklfl/fl;Col10a1-Cre+) (n=8) and RanklΔHTC (Ranklfl/fl;Col10a1-Cre+) (n=8) specimens. *P<0.05, **P<0.01, ***P<0.001. (B-F) Representative images of sections through control, Ctnnb1LOFHTC and ‘complete’ rescue Ctnnb1LOFHTC;RanklΔHTC humeri. (B) Alcian Blue/von Kossa staining. (C) Col1a1 ISH. (D) Osx immunohistochemical staining. (E) CD31 immunohistochemical staining. (F) Col10a1 ISH.