Fig. 6.
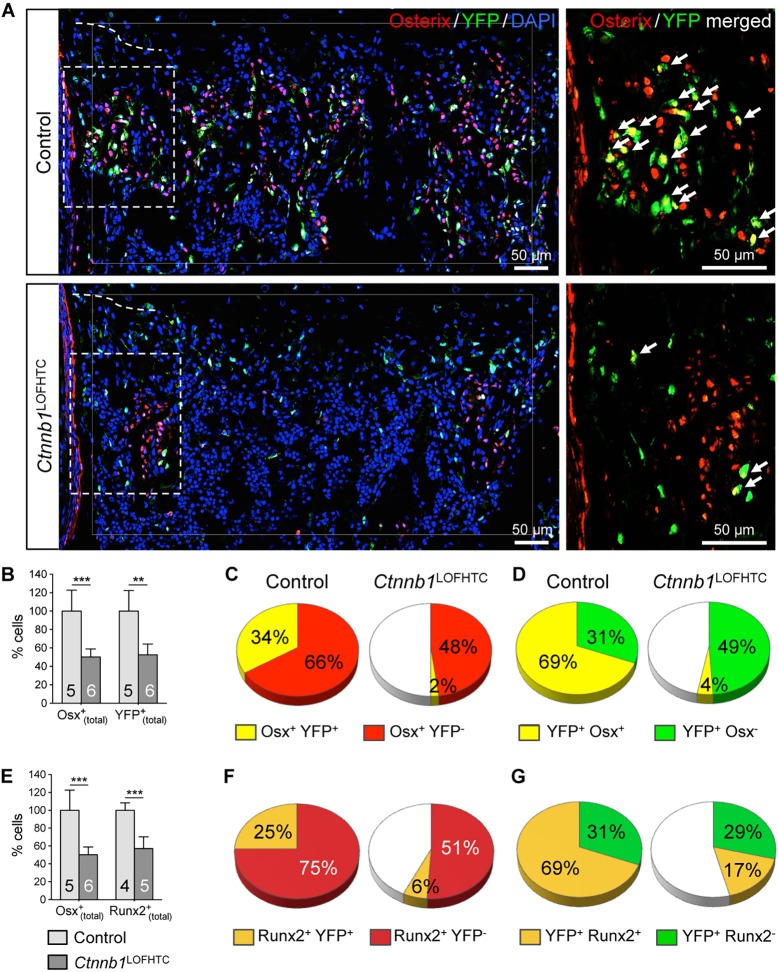
Chondrocyte-derived osteoblastogenesis is affected by the loss of Ctnnb1 from HTCs. (A) Representative images of control and Ctnnb1LOFHTC P0 specimens taken from the region below the chondro-osseous front. Immunofluorescent staining for Osx (red) and YFP (green), and DAPI staining for nuclei (blue). The dashed line indicates the position of the chondro-osseous border. The increase in DAPI-stained cells in the Ctnnb1LOFHTC mutant reflects an increase in cellularity. Higher magnification images of the boxed regions with only the Osx (red) and YFP (green) signals are provided on the right, with double-positive cells marked by arrows. (B) Mean percentage of Osx+(total) and YFP+(total) cells relative to control. (C) The distribution of Osx+ YFP− (perichondrial-derived) and Osx+ YFP+ (chondrocyte-derived) cells normalized with respect to the Osx+(total) population (100%) of the control. (D) The distribution of YFP+ Osx+ (osteoblastic) and YFP+ Osx− (non-osteoblastic) cells normalized with respect to the YFP+(total) population (100%) of the control. (E) The mean percentage of Osx+(total) and Runx2+(total) cells relative to control. (F) The distribution of Runx2+ YFP− (perichondrial-derived) and Runx2+ YFP+ (chondrocyte-derived) cells normalized with respect to the Runx2+(total) population (100%) of the control. (G) The distribution of YFP+ Runx2+ (osteoblastic) and YFP+ Runx2− (non-osteoblastic) cells normalized with respect to the YFP+(total) population (100%) of the control. Cells for B-D were counted within the region indicated by the thin white line in A, and for E-G in a square of the same size on three or four sections per specimen and genotype. Control is Ctnnb1fl/+;Col10a1-Cre+;RosaYFP/+; Ctnnb1LOFHTC is Ctnnb1lacZ/fl;Col10a1-Cre +;RosaYFP/+. (B,E) **P<0.01, ***P<0.001. The number of specimens analyzed (n) is indicated within the bars. Error bars indicate s.d.

