Fig. 7.
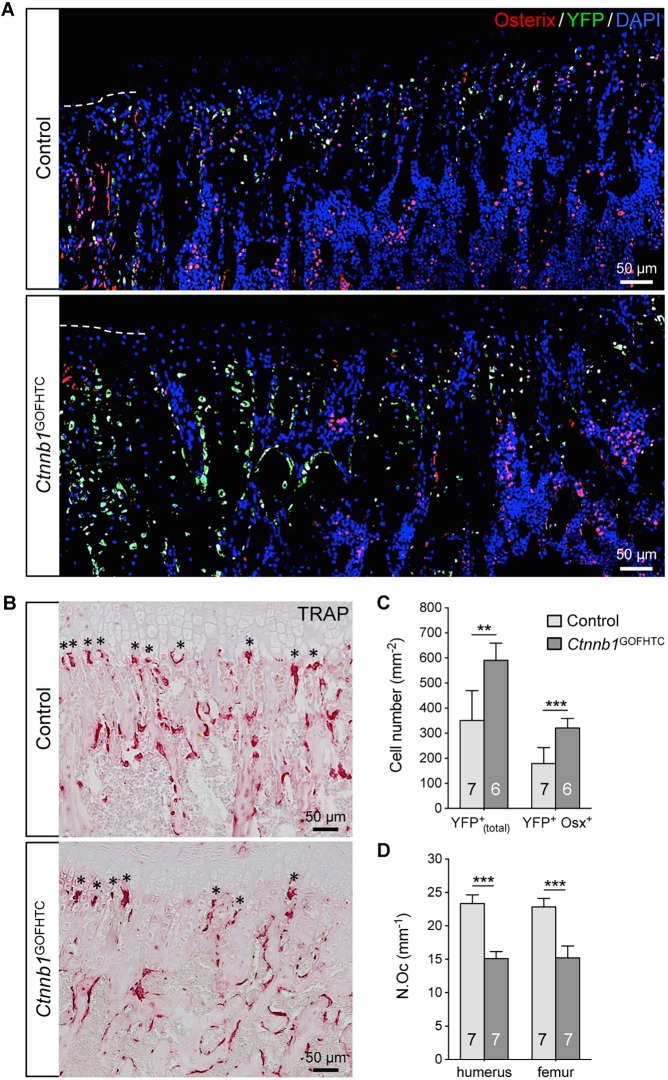
Alteration in chondrocyte-derived osteoblast and osteoclast numbers in P28 Ctnnb1GOFHTC specimens. (A) Representative images of control and Ctnnb1GOFHTC specimens below the chondro-osseous front at the proximal humeral growth plate. Immunofluorescent staining for Osx (red) and YFP (green), and DAPI staining for nuclei (blue). The dashed line indicates the position of the chondro-osseous border. (B) TRAP staining on control and Ctnnb1GOFHTC littermates. Asterisks mark the osteoclasts at the chondro-osseous border. (C) The mean percentage of YFP+(total) (which are progeny of Col10a1-Cre-expressing HTCs) and YFP+ Osx+ (the chondrocyte-derived osteogenic population) cells determined within the area 250 µm below the chondro-osseous front. (D) The mean number of osteoclasts lining the chondro-osseous front (marked by asterisks in B) in humerus and femur of control and Ctnnb1GOFHTC specimens. Control is Col10a1-Cre+;RosaYFP/+; Ctnnb1GOFHTC is Ctnnb1ex3fl/+;Col10a1-Cre+;RosaYFP/+. (C,D) **P<0.01, ***P<0.001. The number of samples analyzed (n) is indicated within the bars. Error bars indicate s.d.

