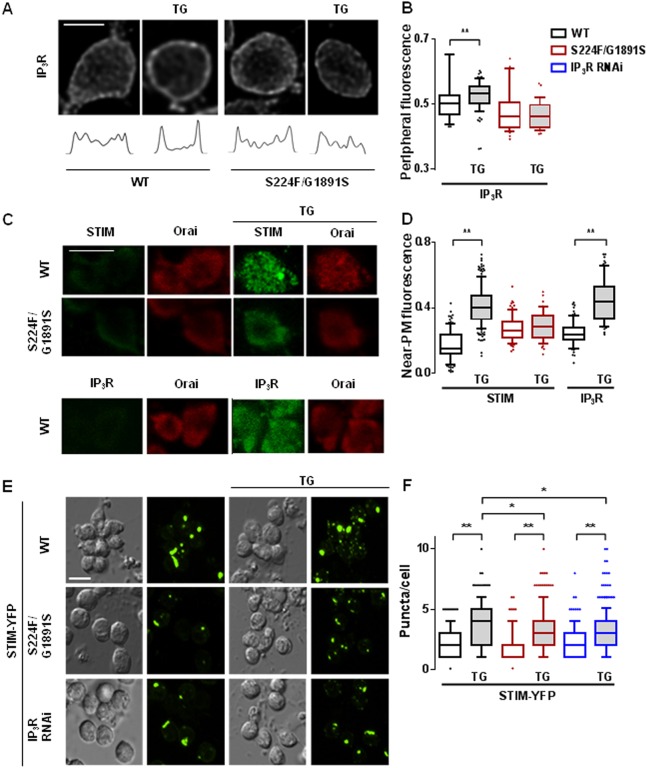
Fig. 3.
Mutant IP3Rs attenuate translocation of IP3R and STIM after store depletion. (A) Typical confocal images across the mid-plane of fixed neurons immunostained for IP3R after treatment with thapsigargin (TG, 10 µM in Ca2+-free HBM for 10 min). Fluorescence profiles are shown below each image. (B) Summary results for peripheral IP3R immunostaining as a fraction of total cellular fluorescence for the indicated genotypes. The same colour key applies to panels B, D and F. (C) Optical section at the plasma membrane of neurons expressing mutant (itprS224F/G1891S) or WT IP3R with and without thapsigargin-treatment showing immunostaining for Orai and STIM or IP3R. (D) Summary results for near-plasma-membrane STIM and IP3R labelling (near-plasma membrane/total). (E) Differential interference contrast (DIC) and optical section of GFP fluorescence at plasma membrane of neurons expressing STIM–YFP with mutant (itprS224F/G1891S) or after treatment with siRNA to IP3R. The effects of treatment with thapsigargin are shown. (F) Summary results for the number of STIM–YFP puncta/cell. In B, D and F, the box represents the 25–75th percentiles, and the median is indicated. The whiskers show the 10–90th percentiles. Outliers are represented by dots. **P<0.01, *P<0.05, Kruskal–Wallis test, followed by Wilcoxon signed-rank post-hoc test [>50 cells from at least five independent experiments (B,D); >200 cells from at least five independent experiments (F)]. Scale bars: 5 µm.

