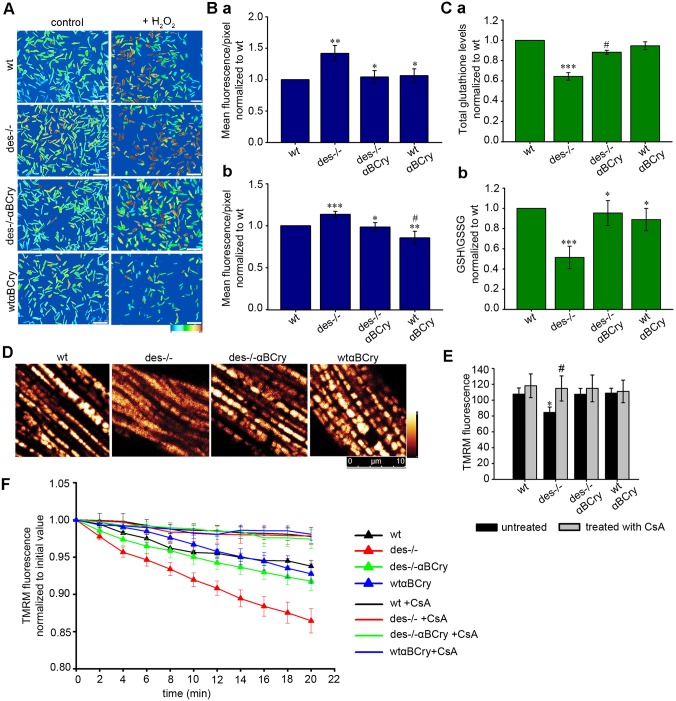
Fig. 4.
αΒ-crystallin overexpression provides anti-oxidant protection to Des−/− cardiomyocytes, inhibits abnormal activation of the mPTP and the dissipation of Δψm. (A) Staining of live adult cardiomyocytes in culture with CM-H2DCFDA to detect ROS, in control conditions and after challenging with H2O2. Color graduation from light blue to brown corresponds to the intensity of CM-H2DCFDA fluorescence and consequently the level of ROS. Scale bar: 250 μm. (Ba) Semi-quantitative determination of CM-H2DCFDA intensity. Values are normalized to those of wild type (wt) (mean±s.e.m.), n=9; **P<0.01 vs wild type, *P<0.05 vs Des−/− (unpaired Student's t-test). (b) Same as panel Ba after incubation with H2O2; ***P<0.001 and #P≤0.05 vs wild type, **P<0.01 and *P<0.05 vs Des−/−; n=9. (C) Total glutathione levels (a) and GSH:GSSG ratio (b) in heart tissue homogenates from 6-month-old mice. Des−/− heart displays only 67%±4.7 (mean±s.e.m.) of the total GSH and 51.43%±11.10 of the reduced GSH compared to wild-type heart, wheteas αΒCry overexpression increases these levels up to 87%±9.3 and 95.39%±12.38, respectively. (a)***P≤0.001 vs the other genotypes, #P<0.001 vs wild type; (b) ***P≤0.001 vs wild type, *P≤0.05 vs Des−/−; n=4 (unpaired Student's t-test). (D) Determination of mitochondrial Δψm by labeling adult cardiomyocytes with the potentiometric probe TMRM. (E) Semi-quantitative determination of the initial TMRM fluorescence; *P<0.05 vs the other genotypes, #P≤0.05 vs untreated (unpaired Student's t-test). (F) Loss of mitochondrial Δψm analysis using 20-min time-lapse confocal imaging of cardiomyocytes loaded with TMRM probe (see also Fig. S2). The mPTP inhibitor cyclosporin A (CsA) was used to confirm the mPTP activation. The error bars show mean±s.e.m.; P<0.01 vs Des−/− and CsA; n=9.

