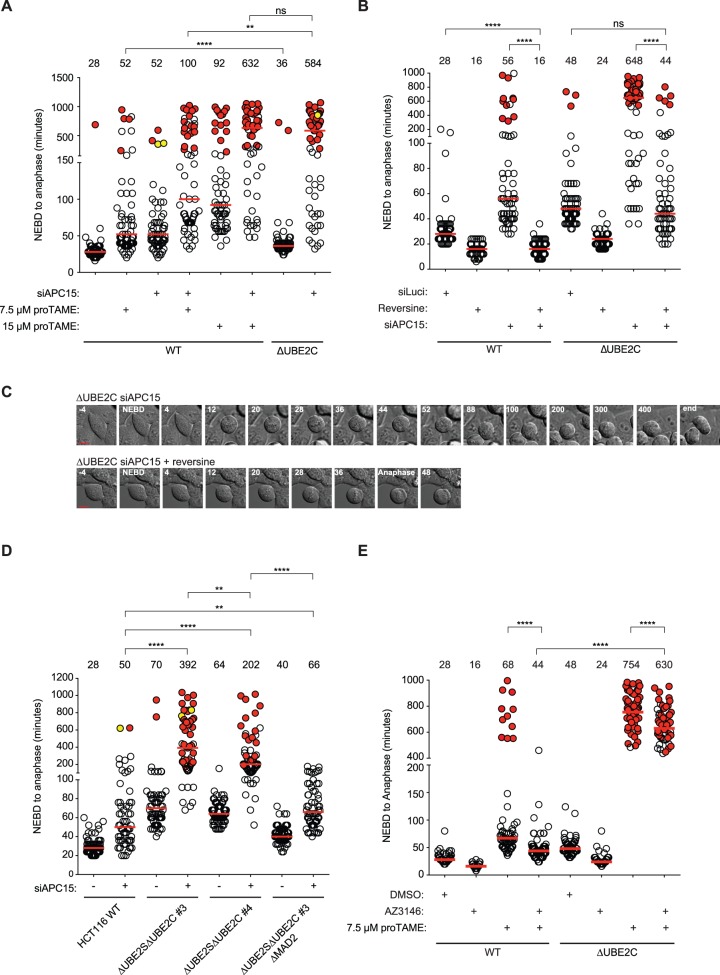
Fig. 3.
The effect of APC15 but not pro-TAME is checkpoint dependent. (A,B) The indicated cell lines were depleted of APC15 or treated with the indicated concentrations of pro-TAME or reversine and mitotic timing was analyzed by time-lapse microscopy. Each circle represents a single cell analyzed and the red line indicates the median, which is also stated in minutes above each condition. Red circles represent cells that did not exit mitosis within the stated time. Yellow circles represent cells that died at the indicated times. ns, non-significant; **P≤0.01, ****P≤0.0001 by Mann–Whitney test. For A, at least 59 cells were analyzed from two independent experiments. For B, at least 60 cells were analyzed from two independent experiments. (C) Representative stills for B. Scale bar: 10 μm. (D) APC15 was depleted in the indicated cell lines and mitotic timing analyzed by time-lapse microscopy. Red-filled circles represent cells that did not exit mitosis within the stated time. Yellow-filled circles represent cells that died at the indicated times. At least 60 cells were analyzed from two independent experiments. **P≤0.01, ****P≤0.0001 by Mann–Whitney test. (E) Indicated cell lines were treated with 7.5 μM pro-TAME and then either DMSO or the Mps1 inhibitor AZ3146 as indicated and mitotic timing analyzed by time-lapse microscopy. At least 60 cells were analyzed from two independent experiments. ****P≤0.0001 by Mann–Whitey test.

